Economic Shockwave: Envisioning 2025 with 1982-Style 18.6% Mortgage Rates
30Y in 30D • Y19. If mortgage rates rise anywhere close to 1982 levels, it makes the median-priced home 100% unaffordable to the median income U.S. family.

Related and recent articles
(Full list of “30 Years in 30 Days” Series articles at bottom of this article.) • 30Y in 30D, Y18: U.S. Mortgages in 1982 vs. 2021 vs. 2023 — the Good, the Bad, and the Ugly • 30Y in 30D • Y16: The Total Cost of Ownership of Your House • Kickstarting “30 Years in 30 Days” — Decades of Mortgage Wisdom in 1 Month • Has U.S. Healthcare Really Become a Mob Protection Racket?
(Subscribe to receive email notifications when I post new articles in this series and on other topics.)
Median house prices were lower back in 1982.
$69,300 in 1982 vs. $420,000 today.
That’s dramatically lower, actually.
But 18% mortgage interest rates in late 1982 meant that even with the far lower median house price of $69,300, a homeowner’s monthly payments were high, and “Total Interest Paid” over the lifetime of the mortgage was shockingly high…even by today’s standards.
In the previous article (30Y in 30D • Y18. U.S. Mortgages in 1982 vs. 2021 vs. 2023 — the Good, the Bad, and the Ugly), we saw what it was like in 1982 when 30-year fixed mortgage rates went as high as 18.63% with those $69,300 median house prices.
And it was tough for those 1982 homebuyers. Really tough.
But that made me wonder….
What would the combination of (1) the 18.63% interest rate of October 1982 AND (2) much higher median house prices in the 2020’s look like?
What would that combo mean for U.S. homebuyers in, say, 2025 if all the real estate pundits are wrong — cataclysmically wrong — in predicting “lower mortgage rates” for 2025?

What if interest rates over the next few years were to rise dramatically higher than predicted?
After all, 30-year fixed mortgage rates in October 1977 were around 8.9%.
That’s somewhat higher than today’s (December 2023) 30-year fixed rates in the mid-7% range but not by much.
And nobody in late 1977 was predicting that fixed rates would rise almost 10 percentage points higher to 18.63% within 5 years.
So it’s not inconceivable that today’s pundits might be getting it just as wrong as the previous generation of pundits got it back in the late 1970s.
What might 18% interest rates look like in the context of today’s (1) median housing prices and (2) median incomes?
What if we saw 18% interest rates on 30-year fixed-rate mortgages as soon as, say, 2025?
What would all of that mean for the median income family in the U.S.?
First, let’s recap what the numbers looked like for January 2021 and October 2023.
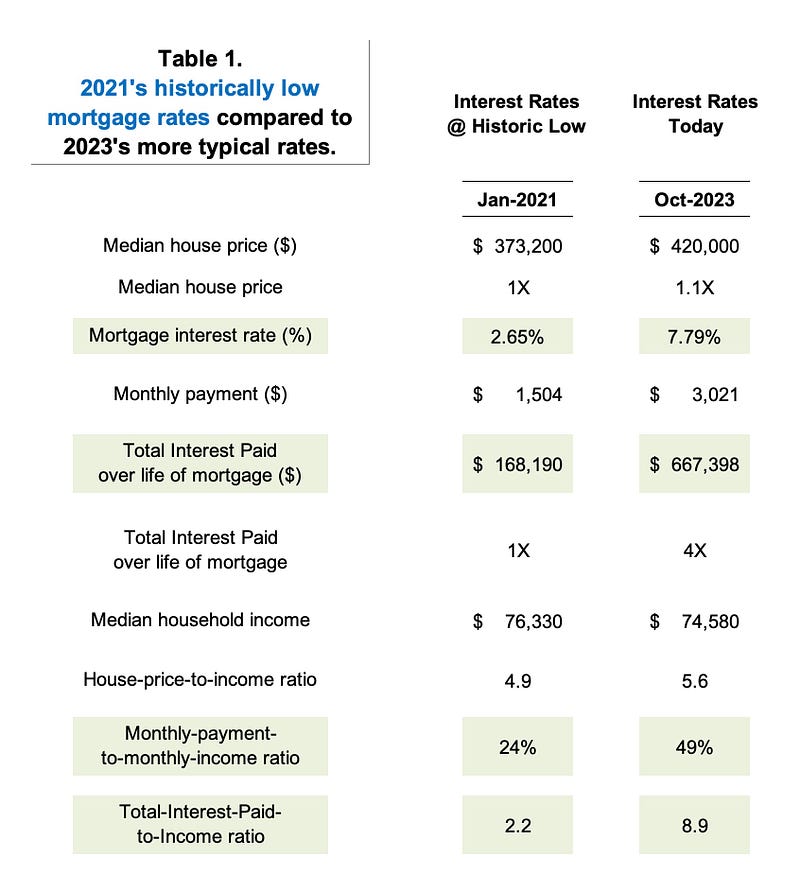
Here’s what I see when I look at this table:
- Median house price: The 10% difference between (1) the median house price in January 2021 at the historic low in mortgage rates vs. (2) the median house price in early Q4 2023 is not a big deal. This 10% increase alone would not make a material difference in the monthly payment or total interest paid.
- Mortgage interest rate: There is, however, a big difference here. 2.65% in January 2021 versus 7.79% in October 2023. The monthly payment amount and the total interest paid over the life of the mortgage will both take a huge jump up as a result of interest rates increasing this much.
- Monthly payment: The monthly payment doubles from January 2021 to October 2023, primarily as a result of the interest rate going up.
- Total Interest Paid over life of the mortgage: And the total interest paid number quadruples over these two years, again primarily as a result of the interest rate going up.
- Ratio of Total Interest Paid to Income: for the median homebuyer purchasing a house and getting an historically low interest rate on their mortgage in January 2021, they will pay 2.2 times their (median) annual income in interest over the life of the mortgage. However, the same median income homebuyer getting the median house in late 2023 will pay 9 years worth of annual income in interest alone over the life of the mortgage.
Think about that for a moment.
Nine years of your income will go toward paying the interest on your 30-year fixed mortgage.
Nine. Years.
And this is for a median income homebuyer getting a mortgage for the median house today in late 2023.
OK, now let’s see what these numbers would look like if 1982-level interest rates were to make an unwelcome reappearance.
No matter what you’re expecting as we combine 18.63% mortgage rates with median house prices over $400,000, you’re gonna be surprised.

Some of the numbers below genuinely stunned me when I realized what they actually would mean to a median-income family.
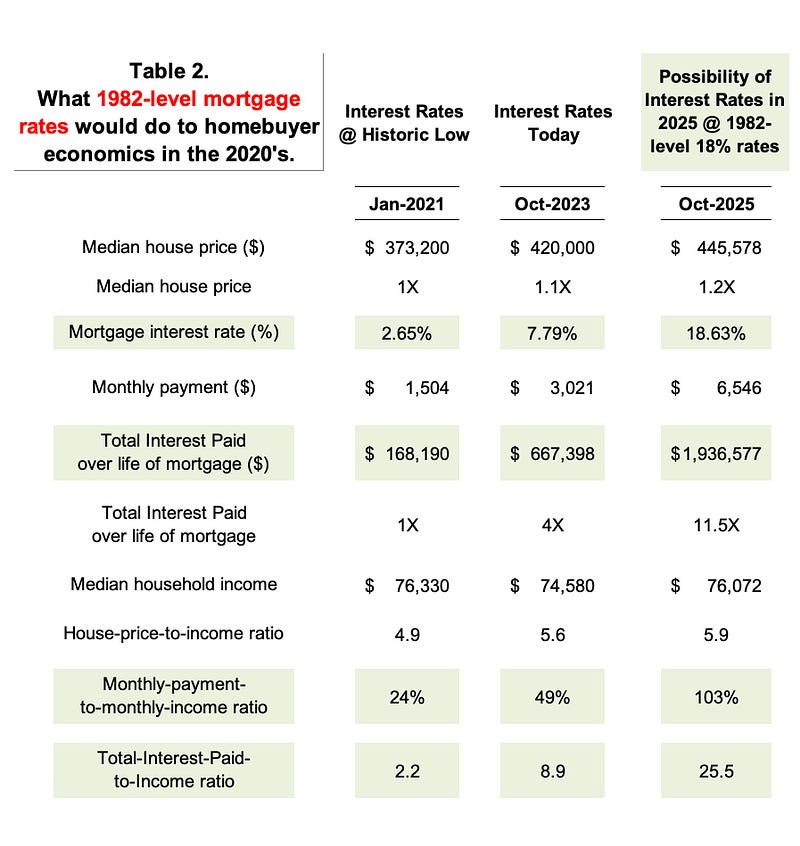
There are 5 takeaways that are crucial to see in the above table:
- At $1,936,000, the Total Interest Paid over the lifetime of the mortgage on this median-priced house is almost 3X — 3 times! — what the interest on a median-priced house today would be.
- But wait — it gets worse. Remember that we are looking at this from the perspective of a median income person in the US. If you’re making the median income, then the interest alone for a 30-year mortgage at 18.63% is the equivalent of more than 25 times the estimated median income for 2025.
- Icing on the cake time — the previous point was only looking at the interest. We didn’t yet factor in the mortgage principal of $445,000. That represents another 5.9 times the estimated median income in 2025. So if we add up the 25X and the 5.9X, that means the cost of paying off a 30-year mortgage at 18.63% would be almost 31X the median income in 2025. So assuming that the median income didn’t change over the next 30 years — which of course is a wrong assumption to be making — you would (1) use every pre-tax dollar you made over the next 30 years to pay off your mortgage; (2) you would not have ANY money left over each month to pay all the other expenses in your life (taxes, education, childcare, food, clothing, transportation, insurance, etc.); and (3) you would STILL come up short in having enough money to pay off your mortgage (remember, the mortgage principal and interest cost 31X your median income, and you only have 30 years worth of that median income.) As I alluded to in the previous paragraph, your median income would hopefully be going up over those 30 years, and a real estimate of this would factor that in. But let’s be clear — a 5% raise each year (which is unlikely to happen every year for 30 years) still wouldn’t make a big enough difference to transform that mortgage into something the median income person could afford.
- It’s worth noting that the ratio of “Monthly payment to monthly median income” is 103%. This makes the same point as we just discussed in #3 immediately above. Median income families can barely afford to buy a house at today’s mortgage rates, and we are rapidly approach mortgage rate levels where they won’t be able to afford the median-priced house at all.
- The only thing that made the 18.63% interest rate even remotely affordable for homebuyers back in 1982 was that house prices — including the median price — were dramatically lower then than they are today. There is always an interest rate or a house price — or a combination of the two — that makes a house definitely, positively unaffordable for the median income person. Clearly 18.63% is way above any reasonable person’s estimate of that “too high” interest rate, given median house prices today.
My best estimate — when we (1) assume a median house price in the low- to mid-$400,000’s range and (2) also factor in all the other regular, normal costs of living in the U.S. today — is that the “definitely too high” interest rate isn’t that much above where we are today. Maybe in the 8.5% to 10% range.
One final note
Remember, all of this applies ONLY to people who need a mortgage to buy a house.
It does NOT apply to the class of people who have enough cash on hand to just pay cash for a house. People in the Top 1% and probably most of the rest of the Top 10%.
For those buyers, the high mortgage interest rates are a non-issue. The purchase price of the house is…just the sales price of the house.
And the cost of a house to them is just a fundamentally different calculation than it is for the median income family.
Related and recent articles
• 30Y in 30D, Y18: U.S. Mortgages in 1982 vs. 2021 vs. 2023 — the Good, the Bad, and the Ugly • 30Y in 30D, Y17: How Saving $20K on PMI with a Bigger Mortgage Down Payment Probably Costs You Over $250K • 30Y in 30D, Y16: The Total Cost of Ownership of Your House • 30Y in 30D, Y15: Simple Question, Complex Answer — The True Purchase Price of Your Home • 30Y in 30D, Y14: What Kind of People Are Getting Loans for Houses Right Now? • 30Y in 30D, Y13: What Does It Take to Pay Off a 30-Year Mortgage in 15 Years? • 30Y in 30D, Year 12: CBS News’ Version of (Not) Helping You Save on Mortgage Interest • 30Y in 30D, Year 11: Dream Home or Financial Freedom? Rethinking the True Cost of Stretching • 30Y in 30D • Year 10: A Tale of Two Eras — Home Buying in 1972 and 2023 • 30Y in 30D • Year 9: Visualizing Savings — Mortgage Charts that Matter • 30Y in 30D • Year 8: The Mechanics of Mortgage Interest — What Really Matters • 30Y in 30D • Year 7: The Big Payoff of Early Extra Payments • 30Y in 30D • Year 6: Mortgage Power Play with a Single $100 Extra Payment • 30Y in 30D • Year 5: Are Car Buyers Smarter than Homebuyers? • 30Y in 30D • Year 4: Accelerate Payoff Via Extra Monthly Payments • 30Y in 30D • Year 3: Early Extra Payments Are Magical • 30Y in 30D • Year 2: Rapid Progress on the 30-Year Mortgage •30Y in 30D • Year 1: Starting Strong on the Mortgage Journey • Kickstarting “30 Years in 30 Days” — Decades of Mortgage Wisdom in 1 Month • A Friend Texted to Ask “Who I Favored” for 2024 but Hated My Answer • Has U.S. Healthcare Really Become a Mob Protection Racket?
(Subscribe to receive email notifications when I post new articles in this series and on other topics.)