avatarShashanka Shekhar

Free AI web copilot to create summaries, insights and extended knowledge, download it at here

4597

Abstract

<b>:</b></p><ul><li>This part of the formula is specifying the column <code><b>SalesAmount</b></code> from the table <code><b>MAX_function</b></code>.</li><li>It tells the <code><b>MAX</b></code> function to look at the values in the <code><b>SalesAmount</b></code> column.</li></ul><p id="b2a3"><code><b>MAX(MAX_function[SalesAmount])</b></code><b>:</b></p><ul><li>The <code><b>MAX</b></code> function is then used to find the maximum value in the <code><b>SalesAmount</b></code> column of the <code><b>MAX_function</b></code> table.</li><li>This means it will return the highest value present in that column.</li></ul><p id="63cb">So, the above DAX will compute the maximum of <code>SalesAmount</code> column of the <code>MAX_function</code> table.</p><h2 id="3a0f">Example:</h2><p id="c9f0"><b>Result</b>: The <code><b>MAX func O/P</b></code> measure calculates the maximum of the <code>SalesAmount</code> column, which would be:</p><p id="d551">MAX of (500, 750, 300) is<b> 750</b></p><figure id="fc28"><img src="https://cdn-images-1.readmedium.com/v2/resize:fit:800/1*nAQXrBVOlzgW5YnCI4q4GQ.png"><figcaption>Result of MAX function</figcaption></figure><h1 id="092f">2. Understanding the MAXX Function:</h1><p id="1241"><b>The table used for MAXX function:</b></p><p id="66cc">We will be using the below table for understanding the use of MAXX function:</p><p id="f59a">The table is called <b>MAXX_Function</b> Table.</p><figure id="b2b7"><img src="https://cdn-images-1.readmedium.com/v2/resize:fit:800/1*BxXqAzmaSeuEFahSXBcL1Q.png"><figcaption>The MAXX_Function Table</figcaption></figure><h1 id="df2f">Columns Explained</h1><ol><li><b>Quantity:</b> This column indicates the number of units of a product.</li><li><b>UnitPrice:</b> This column shows the price per unit of the product.</li></ol><h1 id="1a0a">Data Breakdown</h1><ul><li><b>First Row:</b></li><li><code>Quantity</code>: 5</li><li><code>UnitPrice</code>: 100</li><li><b>Second Row:</b></li><li><code>Quantity</code>: 10</li><li><code>UnitPrice</code>: 85</li><li><b>Third Row:</b></li><li><code>Quantity</code>: 3</li><li><code>UnitPrice</code>: 100</li></ul><h1 id="bd88">Interpretation</h1><p id="15d1">This table can help analyze how pricing strategies change with different purchase quantities, and it can be used to understand and predict customer behavior based on pricing incentives.</p><p id="b901"><b>The DAX function used:</b></p><p id="2f41" type="7">MAXX func O/P = MAXX(MAXX_function, MAXX_function[Quantity]*MAXX_function[UnitPrice])</p><figure id="2610"><img src="https://cdn-images-1.readmedium.com/v2/resize:fit:800/1*96mDJgUcCs3DIjIOROQKig.png"><figcaption>DAX for MAXX func O/P</figcaption></figure><h1 id="6cbc">Explanation</h1><p id="d321"><code><b>MAXX(MAXX_function, MAXX_function[Quantity] * MAXX_function[UnitPrice])</b></code><b>:</b></p><ul><li>The <code>MAXX</code> function evaluates an expression for each row in a table, and then returns the maximum value of these evaluations.</li><li>Here, the expression is <code>MAXX_function[Quantity] * MAXX_function[UnitPrice]</code>.</li><li>This expression calculates the total sales value (Quantity multiplied by UnitPrice) for each row in the <code>MAXX_function</code> table.</li></ul><p id="171a"><b>Evaluation Process</b>:</p><ul><li>The <code>MAXX</code> function goes through each row of the <code>MAXX_function</code> table.</li><li>For each row, it computes <code>Quantity * UnitPrice</code>.</li><li>It then finds the maximum value among these calculated sales values.</li></ul><h2 id="f33f">Example Data</h2><figure id="6026"><img src="https://cdn-images-1.readmedium.com/v2/resize:fit:800/1*BxXqAzmaSeuEFahSXBcL1Q.png"><figcaption></figcaption></figure><h2 id="62be">Calculation</h2><ul><li>For the first row: <code>5 * 100 = 500</code></li><li>For the second row: <code>10 * 85 = 850</code></li><li>For the third row: <code>3 * 100 = 300</code></li></ul><h2 id="c787">Result</h2><ul><li>The <code>MAXX</code> function will return the maximum value from these calculations, which is <code>850</code>.</li></ul><h2 id="7cc9">Summary</h2><ul><li><b>Purpose:</b> The DAX expression calculates the total sales value for each row and then returns the maximum of these values.</li><li><b>Output:</b> In this case, the output would be <code>850</code>.</li></ul><figure id="1174"><img src="https://cdn-images-1.readmedium.com/v2/resize:fit:800/1*oKt8d8grMS1danct194IsQ.png"><figcaption>Result of MAXX function</figcaption></figure><h1 id="51b5">3. Comparing MAX and MAXX functions:</h1><h2 id="d1f1">MAX Function</h2><ul><li><b>Purpose:</b> Returns t

Options

he maximum value in a single column.</li><li><b>Use Case:</b> Ideal for straightforward maximum value retrieval tasks.</li><li><b>Example:</b> Finding the maximum sales amount from a <code>SalesAmount</code> column.</li><li><b>DAX:</b> <code>MAX(Sales[SalesAmount])</code></li><li><b>Calculation:</b> Identifies the highest non-blank value in the <code>SalesAmount</code> column directly.</li><li><b>Output:</b> The maximum value of the sales amounts, e.g., 750.</li></ul><h2 id="4884">MAXX Function</h2><ul><li><b>Purpose:</b> Evaluates an expression for each row in a table and then returns the maximum result.</li><li><b>Use Case:</b> Suitable for complex calculations requiring row-by-row evaluations before determining the maximum.</li><li><b>Example:</b> Calculating the maximum sales value by multiplying <code>Quantity</code> by <code>UnitPrice</code> for each row and then finding the highest result.</li><li><b>DAX:</b> <code>MAXX(Sales, Sales[Quantity] * Sales[UnitPrice])</code></li><li><b>Calculation:</b> Multiplies <code>Quantity</code> by <code>UnitPrice</code> for each row and then identifies the highest calculated value.</li><li><b>Output:</b> The maximum of the calculated values, e.g., 750.</li></ul><h1 id="367c">Key Differences:</h1><h2 id="22e7">Scope:</h2><ul><li><b>MAX:</b> Operates directly on a single column to find its maximum value.</li><li><b>MAXX:</b> Evaluates a custom expression for each row in the table, then finds the maximum of those evaluated values.</li></ul><h2 id="fbf3">Flexibility:</h2><ul><li><b>MAX:</b> Limited to retrieving the maximum value from a single column of numeric data</li><li><b>MAXX:</b> Can perform more complex calculations involving multiple columns or expressions before determining the maximum value.</li></ul><h2 id="72c6">Use Cases:</h2><ul><li><b>MAX:</b> Simple and straightforward maximum value retrieval.</li><li><b>MAXX:</b> Required when you need to evaluate an expression for each row in a table before determining the maximum value.</li></ul><p id="349b" type="7">Download the Data for MAX table from this link.</p><p id="5a43" type="7">Download the Data for MAXX table from this link.</p><div id="a336" class="link-block"> <a href="https://readmedium.com/creating-a-sales-kpi-with-line-graph-in-power-bi-f5fbcc6960a1"> <div> <div> <h2>Creating a Sales KPI with Line Graph in Power BI</h2> <div><h3>In today’s data-driven world, visualizing key performance indicators (KPIs) is crucial for making informed business…</h3></div> <div><p>medium.com</p></div> </div> <div> <div style="background-image: url(https://miro.readmedium.com/v2/resize:fit:320/1*OkkkebA_YGo3dqP1_eO7nA.jpeg)"></div> </div> </div> </a> </div><p id="028d">Thank you for your attention!</p><p id="e297"><a href="https://medium.com/@shashanka.shekhar02">Follow</a> me or <a href="https://medium.com/@shashanka.shekhar02/subscribe">subscribe </a>to get all my Power BI articles!</p><div id="a968" class="link-block"> <a href="https://medium.com/@shashanka.shekhar02"> <div> <div> <h2>Shashanka Shekhar - Medium</h2> <div><h3>Read writing from Shashanka Shekhar on Medium. Contributor for Microsoft Power BI. I like Data Analysis and Data…</h3></div> <div><p>medium.com</p></div> </div> <div> <div style="background-image: url(https://miro.readmedium.com/v2/resize:fit:320/0*s3SmOj72DgLBjAY9)"></div> </div> </div> </a> </div><p id="ce14" type="7">Don’t forget to subscribe to</p><p id="5d20" type="7">👉 Power BI Publication</p><p id="ae1f" type="7">👉 Power BI Newsletter</p><p id="8d8d" type="7">and join our Power BI community:</p><div id="6239" class="link-block"> <a href="https://linktr.ee/powerbi.masterclass?source=post_page-----f5fbcc6960a1--------------------------------"> <div> <div> <h2>Microsoft Power BI Masterclass | Linktree</h2> <div><h3>Let's share our Microsoft Power BI experience. Learn together. Grow together.</h3></div> <div><p>linktr.ee</p></div> </div> <div> <div style="background-image: url(https://miro.readmedium.com/v2/resize:fit:320/0*UMxqurLg8gKq-3eG)"></div> </div> </div> </a> </div></article></body>

Easiest guide to differentiate MAX VS MAXX with examples in Power BI

When analyzing data in Power BI, understanding how to maximize your insights can make a world of difference. Power BI offers two pivotal functions for this task: MAX and MAXX. While they might seem interchangeable at first glance, each is designed for distinct scenarios. In this article, we will uncover the key differences between these two functions and provide practical examples to illustrate their unique applications.

MAX Function:

  • Purpose: Returns the largest value in a column.
  • Usage: Ideal when you need to find the highest value in a specific column.
  • Syntax: MAX(<column>)
  • Example: If you have a column “SalesAmount” in a sales table, MAX(Sales[SalesAmount]) will return the highest sales amount.

MAXX Function:

  • Purpose: Returns the largest value that results from evaluating an expression for each row in a table.
  • Usage: More versatile, used when you need to find the maximum value based on a condition or complex calculation.
  • Syntax: MAXX(<table>, <expression>)
  • Example: If you want to find the highest sales amount for products with sales above 100 units, you could use MAXX(Sales, IF(Sales[Units] > 100, Sales[SalesAmount], BLANK())).

Key Differences:

  • Simplicity: MAX is straightforward and used for finding the highest value in a column.
  • Flexibility: MAXX is more versatile, allowing for complex expressions and conditions.
  • Application: Use MAX for simple maximum value calculations, and MAXX when you need to apply a condition or expression to each row in a table.

Building the KPI

We will go through these steps:

Happy learning!

1. Understanding the MAX Function:

The table used:

We will be using the below table for understanding the use of MAX function:

The table is called MAX_function Table.

The MAX_function Table

The table contains information about sales transactions. It has three columns: SalesAmount, Product, and Date.

Columns Explained

  1. SalesAmount: This column shows the monetary value of each sales transaction.
  2. Product: This column identifies the product associated with each sales transaction.
  3. Date: This column records the date on which each sales transaction occurred.

Data Breakdown

  • First Row:
  • SalesAmount: 500
  • Product: Product A
  • Date: 2024-12-01
  • Second Row:
  • SalesAmount: 750
  • Product: Product B
  • Date: 2024-12-02
  • Third Row:
  • SalesAmount: 300
  • Product: Product C
  • Date: 2024-12-03

Interpretation

This table shows three sales transactions for different products on different dates, with the sales amounts recorded for each transaction. It can be used to analyze sales performance, track product popularity, or manage inventory based on sales data.

The DAX function used:

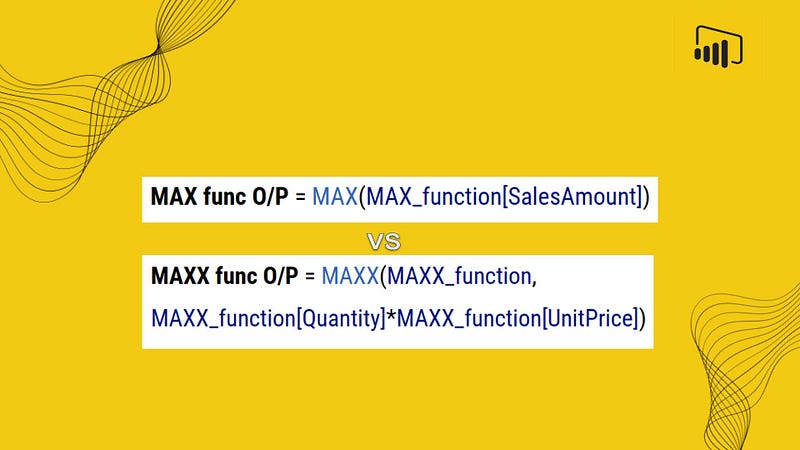
MAX func O/P = MAX(MAX_function[SalesAmount])

DAX for MAX function O/P

Explanation

MAX_function[SalesAmount]:

  • This part of the formula is specifying the column SalesAmount from the table MAX_function.
  • It tells the MAX function to look at the values in the SalesAmount column.

MAX(MAX_function[SalesAmount]):

  • The MAX function is then used to find the maximum value in the SalesAmount column of the MAX_function table.
  • This means it will return the highest value present in that column.

So, the above DAX will compute the maximum of SalesAmount column of the MAX_function table.

Example:

Result: The MAX func O/P measure calculates the maximum of the SalesAmount column, which would be:

MAX of (500, 750, 300) is 750

Result of MAX function

2. Understanding the MAXX Function:

The table used for MAXX function:

We will be using the below table for understanding the use of MAXX function:

The table is called MAXX_Function Table.
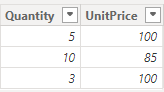
The MAXX_Function Table

Columns Explained

  1. Quantity: This column indicates the number of units of a product.
  2. UnitPrice: This column shows the price per unit of the product.

Data Breakdown

  • First Row:
  • Quantity: 5
  • UnitPrice: 100
  • Second Row:
  • Quantity: 10
  • UnitPrice: 85
  • Third Row:
  • Quantity: 3
  • UnitPrice: 100

Interpretation

This table can help analyze how pricing strategies change with different purchase quantities, and it can be used to understand and predict customer behavior based on pricing incentives.

The DAX function used:

MAXX func O/P = MAXX(MAXX_function, MAXX_function[Quantity]*MAXX_function[UnitPrice])

DAX for MAXX func O/P

Explanation

MAXX(MAXX_function, MAXX_function[Quantity] * MAXX_function[UnitPrice]):

  • The MAXX function evaluates an expression for each row in a table, and then returns the maximum value of these evaluations.
  • Here, the expression is MAXX_function[Quantity] * MAXX_function[UnitPrice].
  • This expression calculates the total sales value (Quantity multiplied by UnitPrice) for each row in the MAXX_function table.

Evaluation Process:

  • The MAXX function goes through each row of the MAXX_function table.
  • For each row, it computes Quantity * UnitPrice.
  • It then finds the maximum value among these calculated sales values.

Example Data

Calculation

  • For the first row: 5 * 100 = 500
  • For the second row: 10 * 85 = 850
  • For the third row: 3 * 100 = 300

Result

  • The MAXX function will return the maximum value from these calculations, which is 850.

Summary

  • Purpose: The DAX expression calculates the total sales value for each row and then returns the maximum of these values.
  • Output: In this case, the output would be 850.
Result of MAXX function

3. Comparing MAX and MAXX functions:

MAX Function

  • Purpose: Returns the maximum value in a single column.
  • Use Case: Ideal for straightforward maximum value retrieval tasks.
  • Example: Finding the maximum sales amount from a SalesAmount column.
  • DAX: MAX(Sales[SalesAmount])
  • Calculation: Identifies the highest non-blank value in the SalesAmount column directly.
  • Output: The maximum value of the sales amounts, e.g., 750.

MAXX Function

  • Purpose: Evaluates an expression for each row in a table and then returns the maximum result.
  • Use Case: Suitable for complex calculations requiring row-by-row evaluations before determining the maximum.
  • Example: Calculating the maximum sales value by multiplying Quantity by UnitPrice for each row and then finding the highest result.
  • DAX: MAXX(Sales, Sales[Quantity] * Sales[UnitPrice])
  • Calculation: Multiplies Quantity by UnitPrice for each row and then identifies the highest calculated value.
  • Output: The maximum of the calculated values, e.g., 750.

Key Differences:

Scope:

  • MAX: Operates directly on a single column to find its maximum value.
  • MAXX: Evaluates a custom expression for each row in the table, then finds the maximum of those evaluated values.

Flexibility:

  • MAX: Limited to retrieving the maximum value from a single column of numeric data
  • MAXX: Can perform more complex calculations involving multiple columns or expressions before determining the maximum value.

Use Cases:

  • MAX: Simple and straightforward maximum value retrieval.
  • MAXX: Required when you need to evaluate an expression for each row in a table before determining the maximum value.

Download the Data for MAX table from this link.

Download the Data for MAXX table from this link.

Thank you for your attention!

Follow me or subscribe to get all my Power BI articles!

Don’t forget to subscribe to

👉 Power BI Publication

👉 Power BI Newsletter

and join our Power BI community:

Power Bi
Data Visualization
Business
Data Science
Finance
Recommended from ReadMedium