
Did This Happen by Accident to 89% of America’s Stock Market Wealth?
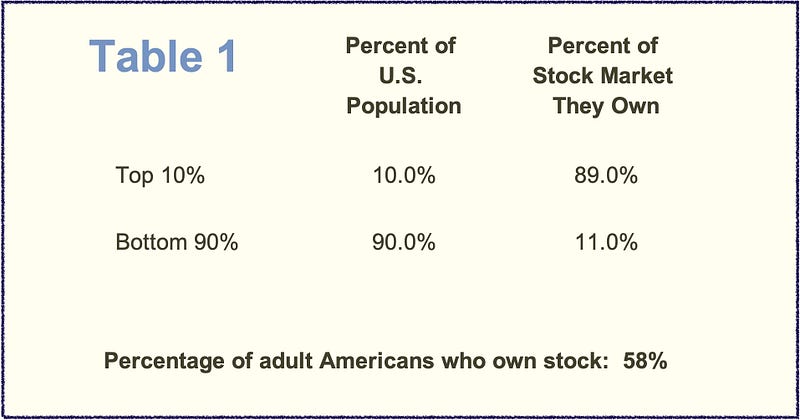
Two well-known facts about the US stock market: (1) The Top 10% owns 89% of all US stocks. (2) 58% of adult Americans own stock. But . . .
Related and recent articles
• (Part 1) The 5 Most Important U.S. Economic Events Over the Last 50 Years • Has U.S. Healthcare Really Become a Mob Protection Racket? • The Social Contract Broke in the U.S. Years Later Than in Japan • WTF! Our Taxpayer Money Will Pay for Intel’s $130 Billion in Stock Buybacks and Dividends? • The Samuel L. Jackson Approach to Dealing with Centrist Democrats Post-Roe and Pre-2022 Midterms • Pressing Where It Hurts: How to Win Fights That Matter
(Subscribe to receive email notifications when I post new articles.)
These two well-known, often-quoted stats are both at least technically true.
But whether technically true or not, they are each deeply misleading.
Two goals for today
- Look at how ownership of the U.S. stock market actually breaks down.
- Step through the “thinking chain” that took me from the two facts (above) to conclusions that go to a very different place than what popular “facts” would have you think.
I promise — you’re not going to see this on CNBC or Fox Business, and you’re certainly not going to read about it in the Wall Street Journal or the New York Times Business section.
How do regular working Americans think about the U.S. stock market?
Here is what people generally take away from the well-known “facts” that (1) 58% of adult Americans own stock; and (2) the Top 10% owns 89% of all US stocks:
- Lots of Americans own stock.
- It’s in the interest of “most Americans” that the stock market does well since “so many Americans” own stock.
- “Most Americans” should cheer, then, when the stock market goes up, whether or not they personally own stock, because hey, this benefits “most Americans.”
- A relatively small percentage of Americans (10%) own a relatively large percentage of U.S. stocks (89%), but again, since “most Americans” own stock and benefit from our stock market — especially when it’s going up! — we shouldn’t really complain about Wall Street bailouts, extra beneficial tax rules for Top 1% stock owners, etc.
Those two facts above probably don’t technically qualify as bald-faced lies . . .
. . . but they mislead people in such a deep, slimy, self-serving way that I’m not going to argue with anyone who wants to say that they are “functionally” the exact same things as “bald-faced lies.”
It’s drill-down time

We’re going to drill down into this, and the only tools we need are:
- 6th grade math (addition, subtraction, multiplication, division);
- common sense;
- an unwillingness to be deflected or deceived; and
- fairness and intellectual honesty — we will go where the facts lead us.
To stay with the “drilling” metaphor, the good news here is, we’re not going to have to work too hard on this — turns out that we’ll be drilling into some very soft wood.
The percentages are vague. Can we attach some numbers to them?
The percentages in the two statistics we started with are vague. Whenever I see stats this vague, I’m always suspicious. Where did they come from? Who originally released them? Who is pushing them in the media? Do these people have an interest in making me believe stats that might not align with my interests . . . or the interests of most people out there? Could their interests be harmful to me, and are they trying to disguise and camouflage what they’re doing?
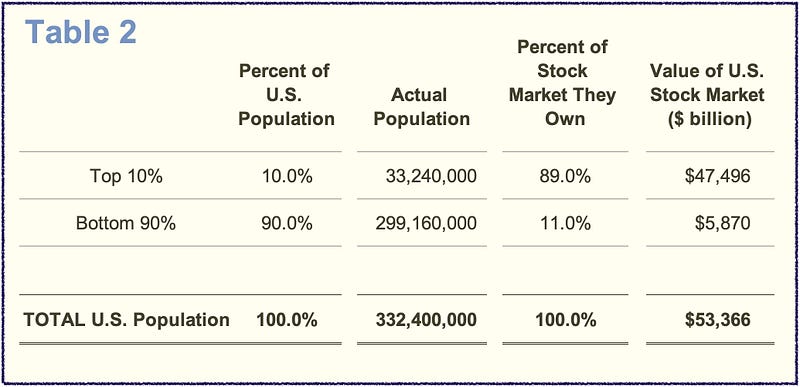
With that line of thinking, the first thing I did was look up (1) the current population of the U.S. and the total value — as of the end of December 2021 — of the U.S. stock market. I want to attach some numbers to the percentages so that I can really begin to understand what might be going on.
We now see that:
- The Top 10% of the U.S. population — about 33.2 million people — own about $47.5 trillion worth of stock in the U.S.
- And the Bottom 90% — just over 299 million people own about $5.9 trillion worth of stock.
Hmm…that starts to give me some perspective. U.S. GDP (gross domestic product) in 2021 was $23 trillion. So the top 10% of the population in the US, — about 33.2 million people — owns stock that is worth about twice what US annual GDP currently is. OK, that gives me a rough idea of how much stock the Top 10% owns. It's a lot.
But then I start to think, well, wait a minute, there's a big difference between the amount of stock owned by these two populations, the top 10% and the bottom 90%. What the top 10% owns in total is 8 times as much in dollar value as what the bottom 90% owns in total.
But at the same time, there are 9 times as many people in the bottom 90% as there are in the top 10%. We are not yet looking at numbers that make those two factors clear. Let's calculate the per-person numbers for the Top 10% and for the Bottom 90%.
It’s now clear that per-person numbers in each group is what we should focus on
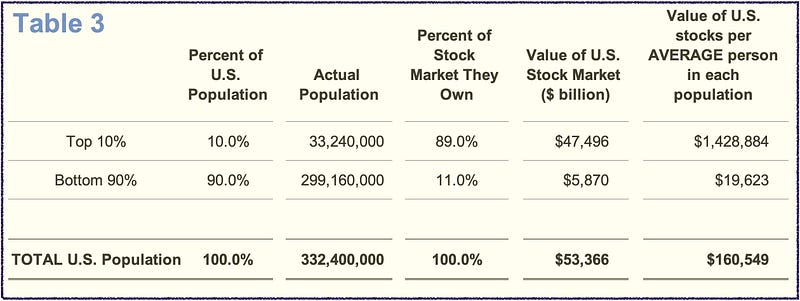
OK, now it's getting interesting. Look at the difference in the per person number for the average person in each of the two groups.
The average person in the top 10% owns over $1.4 million in stock. The average person in the bottom 90% only owns $19,623 in US stocks. The first number is over 72 times the second number.
So my takeaway now is that there is a pretty massive difference between what the average person owns in US stocks in each of these two groups.
And it's starting to look to me as though the top 10% has a pretty huge interest in the stock market doing well and continuing to go up . . .
. . . while for the bottom 90%, it's looking a lot less like the stock market going up makes any difference in their lives.
For an individual in the bottom 90%, $19,000 will get you through part of the year in terms of living expenses, and that's it. It's not going to set you up for retirement. It's less than half of what a new car costs these days. It's not a down payment on a house. It's probably a nice emergency cushion for a few months as long as you don't have some thing like even a small medical emergency, because in the US, $19,000 does not go as far as it used to for things like that.
But then I started to think, wait a minute. I've read a lot for years now that while it is true that the top 10% in the US does much better than the bottom 90%, it's even more true that the top 1% way WAY better than the other nine percentage points of the top 10%. Can I divide up the top 10% and see what the numbers look like then?
And at the same time, I just read that in the US, the bottom 50% of the population only owns 0.6% of US stocks. Let's divide up the bottom 90% at the same time that we divide up the top 10%.
Things look WAY different when we see details within the top 10% and within the bottom 90%.
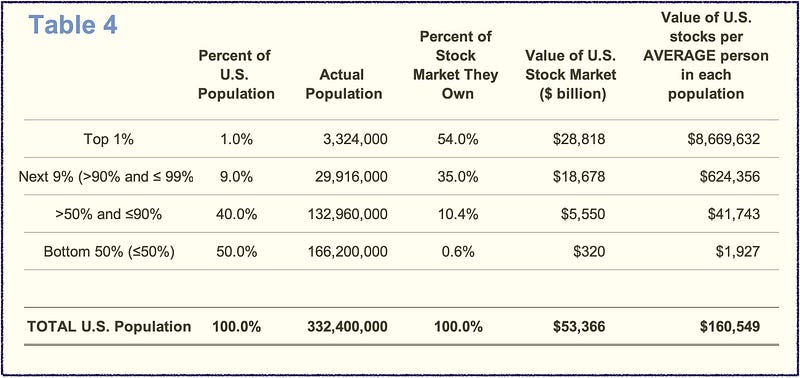
The BusinessInsider article tells us that “according to Federal Reserve data, the top 1% hold 54% of corporate equities and mutual-fund shares.”
Since we know that the Top 10% holds 89% of all stocks — this is where our 6th grade math skills come in handy — 89% minus 54% equals 35%.
So the Top 1% has 54% of stocks, and the “next 9%” holds the remaining 35% of U.S. stocks. I plugged those two numbers into the top two rows of the spreadsheet.
The same BusinessInsider article also tells us that “the bottom 50% holds just 0.6% of corporate equities and mutual-fund shares.”
Ok, it’s time again to pull out our 6th grade math skills.
We already knew that the Bottom 90% of the population owned 11% of U.S. stocks. Now we know that the Bottom 50% owns 0.6% of stocks.
The Bottom 90% minus the Bottom 50% is the 40% of the population between 50% and 90%.
And that 40% chunk of the population will own 10.4% of stocks since we just learned that the Bottom 50% owns 0.6%. (11% minus 0.6% equals 10.4%. Sixth grade math to the rescue!)
(Note: I’m going to show Table 4 again just below here for convenience as I comment on the takeaways for this section.)
Here’s what I am thinking about as I look at Table 4:
- Holy crap, the difference between the top 1% and the next 9% is huge — the average person in the Top 1% has almost 14 times the stock wealth of the average person in the rest of the Top 10%!
- But wait, the difference between the (1) Top 1% and (2) the 40% of the population just below the top 10% is 15 times larger than that 14X factor from a moment ago. The average person in the Top 1% has 207 times the stock wealth of that 40% chunk of the population.
- And —whaaat?— the average person in the Top 1% has 4,500 times (!) the stock wealth of the average person in the Bottom 50% (i.e., the “Bottom Half”) of the U.S. population. 4500 times — how does that even make sense?
I was planning to finish the article here when I saw something in an article from Deb Hayden earlier this morning where she noted that 56% of the U.S. population owns *any* stock, according to the Motley Fool.
I did a bit more digging and found a slightly more recent number that says — according to self-reported information in a Gallop Poll — 58% of the U.S. population owns stock.
To be more conservative, I’m going to go with the 58% number. I’d also note that I’m a bit cautious and skeptical with either number because self-reported data is often inaccurate. I would be more confident if the numbers came from a government agency I trusted, but bottom line, the difference between 58% or 56% or even 50% is not going to materially change the overall message of what we are seeing here.
Here is the important takeaway from this one number. (Again, it’s 6th grade math time.)
If 58% of the population owns *any* amount of stock, then that means that 42% of the U.S. population owns NO stock. 100% minus 58% equals 42%.
Let me repeat that: “The Bottom 42% of the U.S. population owns exactly ZERO stocks.”
Ok, with that in mind, it’s time for the last chart.
Wait…how many people in the U.S. own NO stocks??
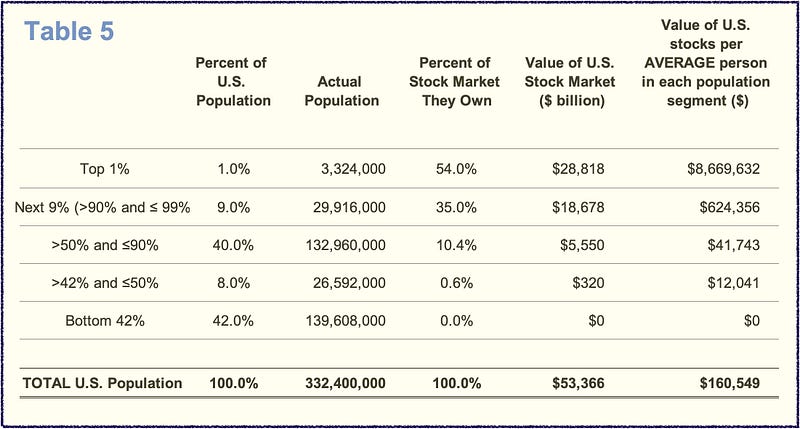
We’ve now broken up the “Bottom 50%” row from Table 4 into two rows in Table 5:
- Bottom 42% of the population that owns no stock. Zero. Zilch. Nada. Bupkis.
- The remaining 8 percentage points of the Bottom 50% that we now know owns all of the 0.6% of U.S. stocks belonging to the Bottom 50%.
For today, I think I’ve “pulled the thread from the cloth” about as far as I can with this data.
What are my takeaways? What is going through my head at the end here?
First, this idea that we Americans are all in this together because we ALL have some ownership in the stock market…? That is a crock of shit.
- 42% of Americans have ZERO stock ownership. That’s 140 million people.
- Another 26 million (the next 8%) have so little ownership that what they do have is maybe a few months living expenses as an emergency cushion.
- And the next 40% of Americans — that 133 million chunk of people — only have an average of $41,700 in stock ownership…? That’s less than the price of a new car these days; it’s certainly not what it takes for a person to retire; and it could easily get wiped out by just a single personal medical emergency.
These three groups of people make up just under 300 million Americans — i.e., 90% of the population!
Out of 332 million Americans, 300 million of them do not have anywhere near the average individual level of stock ownership wealth that the Top 10% does and definitely nowhere remotely near what the Top 1% has.
It is clear that the Top 1% in America have a compelling financial interest in the stock market doing well and continuing to go up that is not shared at all by the bottom 140 million Americans and not shared to any significant degree by the next 158 million Americans.
Every time you see a U.S. President or a media figure talking about the stock market as though it is a good indicator for how well America as a whole is doing, well, your bullshit detectors should start ringing like church bells!
Finally, and this may be the most important part, the most important takeaway:
None of this happened by accident.
Wealth inequality levels in the US right now are at highs that we haven't seen since the gilded age in the 1920s just before the 1929 Stock Market Crash and The Great Depression.
The way that income gets distributed within America began changing dramatically in the 1970s. This shows up in so many ways and in so many places throughout the macroeconomic data that it’s just not something that can be disputed.
Income and wealth inequality is there, it exists, and it makes a huge difference in the lives of regular working Americans. The people who do dispute it are generally either (1) people who benefit from the status quo as it is today or (2) people who just haven’t done their homework on the topic.
If you’re interested in learning more about this, there are a variety of sources, but a particularly good place to start is the Rand Corporation study released in September 2020 entitled “Trends in Income From 1975 to 2018.” Time Magazine also did a cover story on this topic in the same month, and it’s a good summary of the Rand report.
Again, wealth inequality did not get this out of whack in the U.S. by accident.
I’ll have more to say about the “why” and “how” of wealth and income inequality in America in upcoming articles, but I am keenly interested in reader opinions on this. What root causes do you see for why income inequality in the U.S. has stretched to “third-world country” levels…?
Please leave comments and questions below. And thank you for your time and attention!
Related and recent articles
• (Part 1) The 5 Most Important U.S. Economic Events Over the Last 50 Years • Has U.S. Healthcare Really Become a Mob Protection Racket? • The Social Contract Broke in the U.S. Years Later Than in Japan • WTF! Our Taxpayer Money Will Pay for Intel’s $130 Billion in Stock Buybacks and Dividends? • The Samuel L. Jackson Approach to Dealing with Centrist Democrats Post-Roe and Pre-2022 Midterms • Pressing Where It Hurts: How to Win Fights That Matter
(Subscribe to receive email notifications when I post new articles.)
As always, thank you for reading, subscribing, clapping, and sharing — I appreciate you sharing your time and attention!