deck.gl and Mapbox GL JS: Better Together
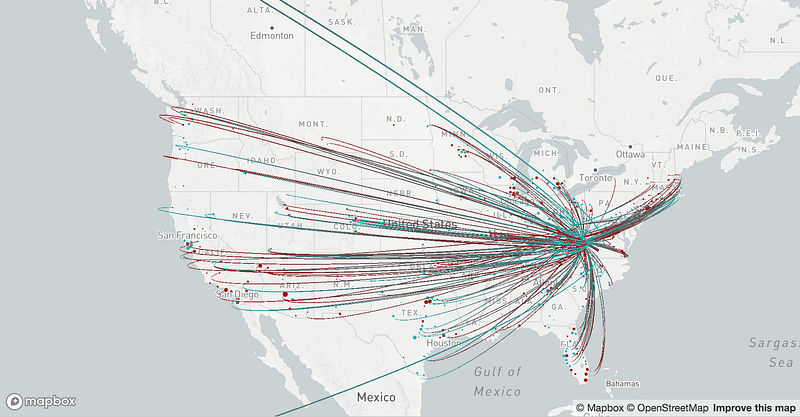
deck.gl, Uber’s large-scale WebGL-powered data visualization framework, and Mapbox GL JS are frequently used together to create compelling geospatial visualizations. deck.gl’s MapView is designed to work in tandem with Mapbox basemaps — the same camera settings (center, zoom, pitch, and bearing) in both libraries will produce seamlessly matched results. We use Mapbox as a backdrop for deck.gl’s visualization layers in nearly all of Uber’s geospatial data applications.
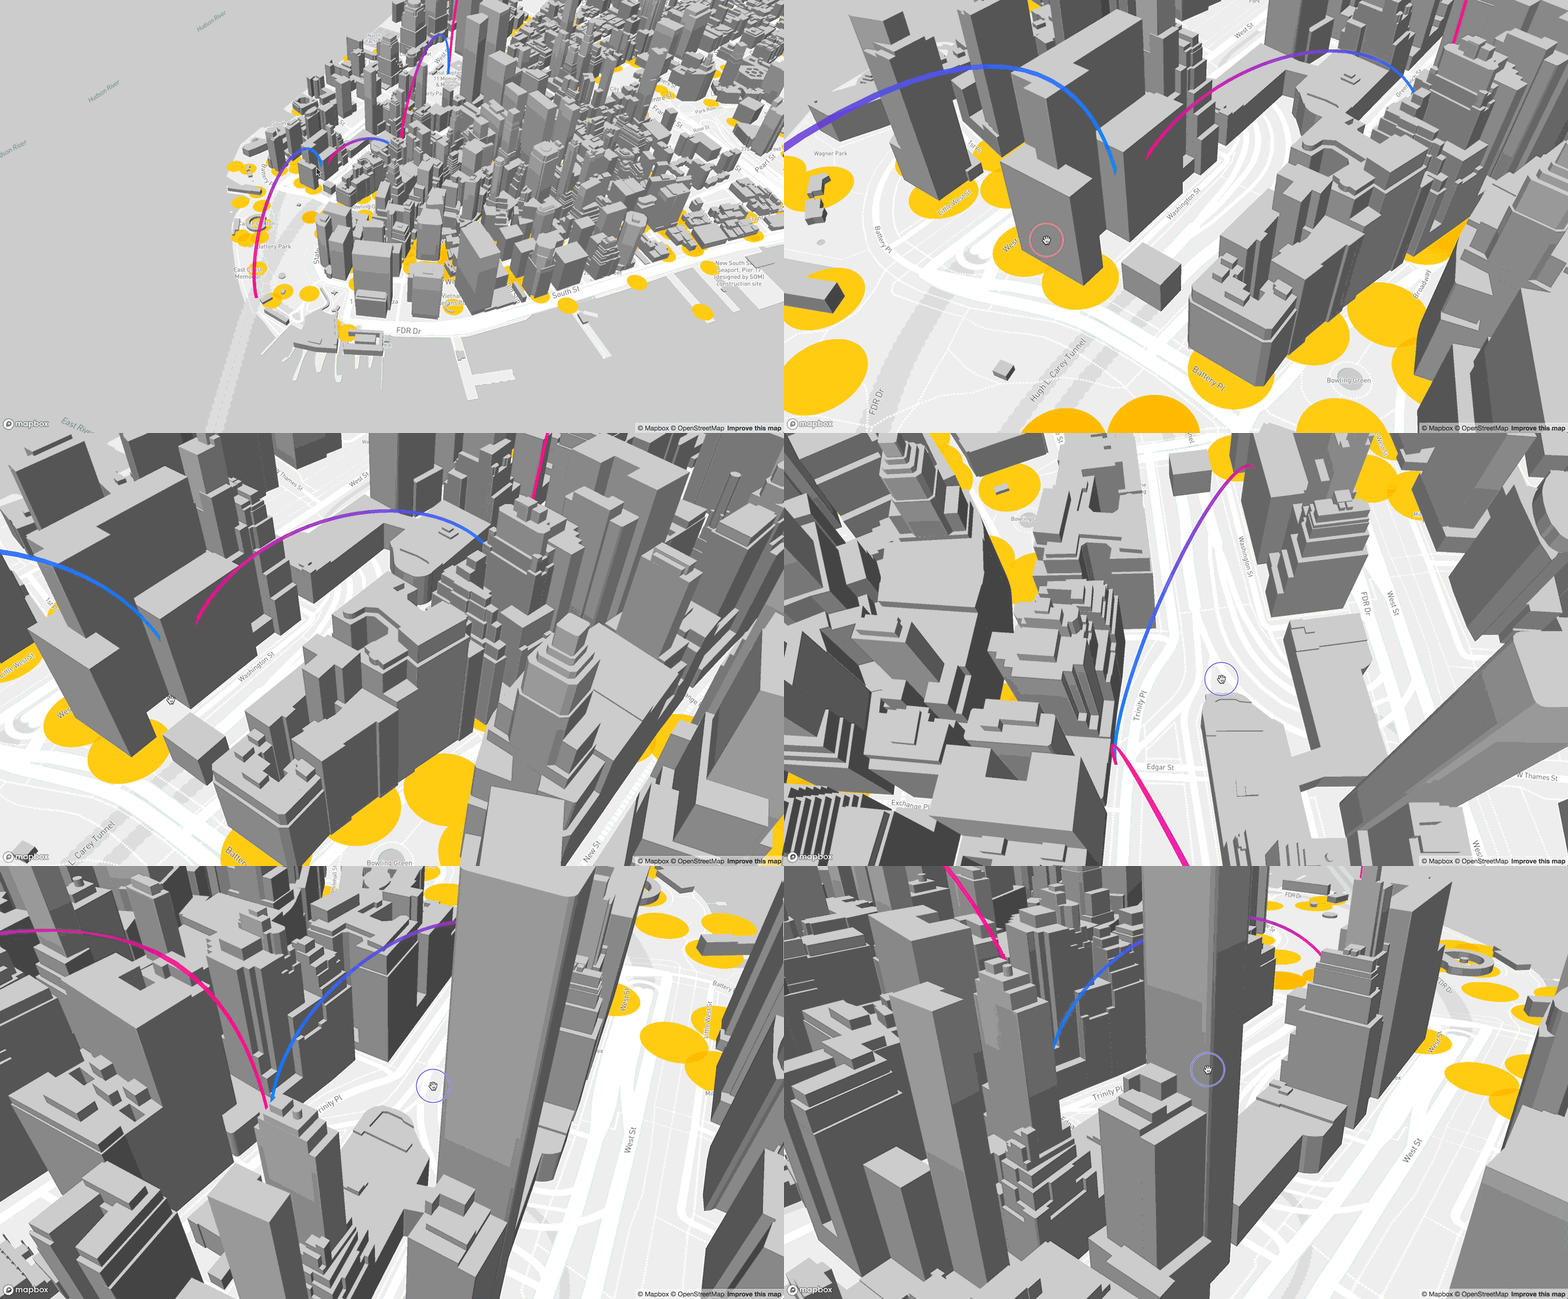
Mapbox GL JS’s latest release (v0.50) enables third-party layers to draw into the same WebGL context that a Mapbox map is rendered in. This opens many new possibilities for even more tightly integrated geospatial visualizations. For example, a deck.gl GeoJSON layer can be inserted in between Mapbox’s base geographic and label layers, so that filled polygons no longer cover up the map labels. deck.gl’s arc layer and Mapbox’s buildings layer may cohabit the airspace of a city, with 3D elements correctly obscuring each other.
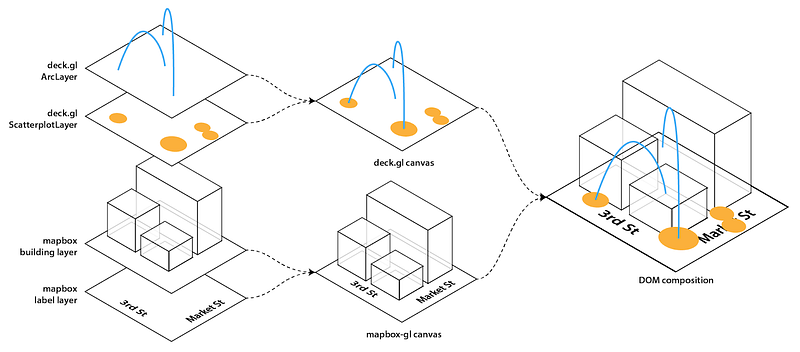
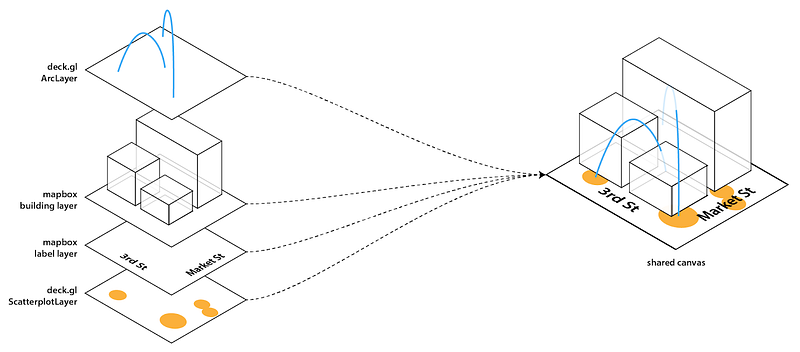
We are excited to announce that deck.gl is supporting these scenarios on day zero with release v6.2 by adding a new module, @deck.gl/mapbox, to the Uber data visualization family.
Getting Started
The new experimental class, MapboxLayer, is an implementation of Mapbox GL JS’s custom layer interface. It can be imported either via the npm module:
npm install @deck.gl/mapboximport {MapboxLayer} from ‘@deck.gl/mapbox’;Or the deck.gl standalone bundle:
<script src=”https://unpkg.com/deck.gl@^6.2.0/deckgl.min.js"></script>
<script src=’https://api.tiles.mapbox.com/mapbox-gl-js/v0.50.0/mapbox-gl.js'></script>
<script type=”text/javascript”>
 const {MapboxLayer} = deck;
</script>
Instances of MapboxLayer can be added to Mapbox’s layer stack using map.addLayer(). The class constructor comes with two flavors, one for Mapbox developers and one for deck.gl developers.
Using deck.gl layers as a Mapbox add-on
You may make a MapboxLayer using any layer type from deck.gl’s layer catalog and its corresponding props:
Note that when used this way, WebGL2-based deck.gl features, such as attribute transitions and GPU accelerated aggregation, are not supported.
Adding Mapbox integration to deck.gl React apps
It is also easy to modify a working deck.gl React app to leverage the new Mapbox integration. To do this:
- Upgrade the app’s react-map-gl dependency to version 4.0.0-beta. This version allows us to supply the WebGL context that deck.gl created for Mapbox to draw into.
- Pass layers into a
component as usual. - When the Mapbox map is loaded, we create and add MapboxLayers to Mapbox by referencing the id of an existing layer in the deck.gl stack.
Integration examples
Road Accidents in the U.K.
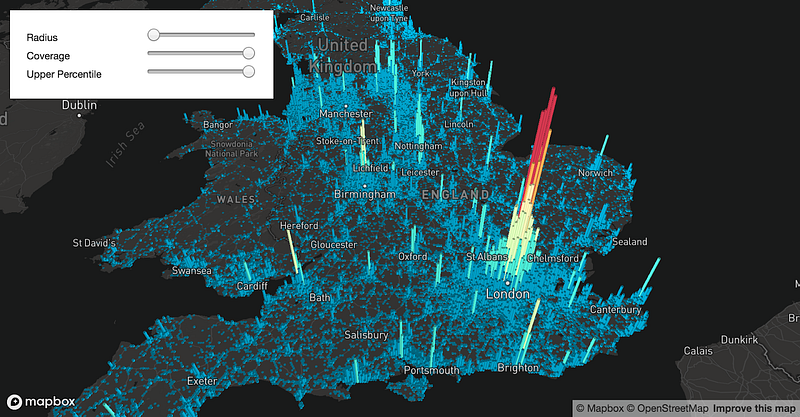
This visualization depicts personal injury road accidents in the U.K. from 1979 through 2016. It uses deck.gl’s HexagonLayer to aggregate data within the boundary of each hexagon cell. The HexagonLayer is inserted underneath Mapbox’s label layers. Click here to explore
US County-to-County Migration
This visualization shows county-to-county migration in the U.S. between 2009–2013. Hover over the map to see the people moving in and out of any particular region. It uses a custom deck.gl layer that filters arcs based on mouse position. Click here to explore