
Start Scripting with deck.gl
deck.gl is designed to make WebGL-based visualization simple. It powers many web applications at Uber that visualize large data sets with high performance.
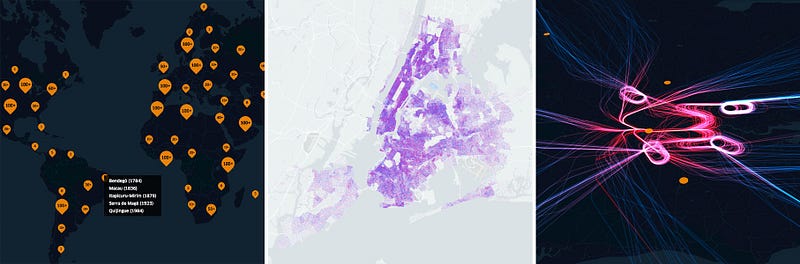
Up until now, most of the deck.gl examples were dependent on React. React is a great framework for making complex web applications, but an overkill for prototyping. There are times we just want to quickly check the shape of some data, play with ideas, and share the result without having to deal with npm dependencies, a JavaScript compiler, bundler or a dev server.
As we release deck.gl v5.2.0, we are also adding a standalone bundled version of the library. It offers a native JavaScript scripting interface like that of d3.js. You can now use deck.gl in prototype environments such as Codepen, JSFiddle and Observable. We hope that this effort makes it easier for designers, creative coders and data scientists everywhere to leverage WebGL for interactive visualizations.
My First deck.gl App
A webpage may now include a single-file version of deck.gl using the script tag: https://unpkg.com/deck.gl@~5.2.0/deckgl.min.js. This adds an object deck to the global scope.
Copy the following code into a text editor, save as index.html, and double click to open in a browser:
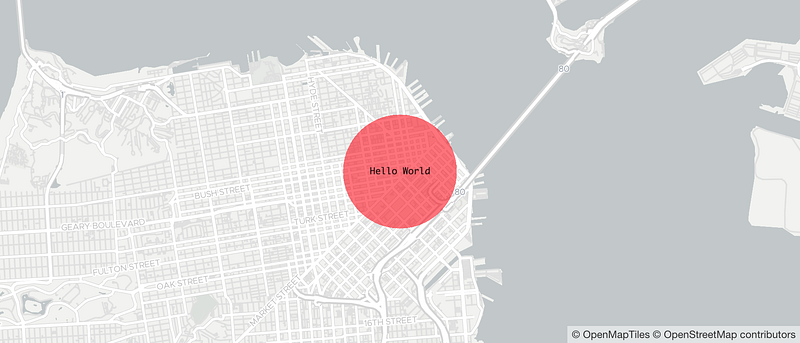
In the following sections I will walk through the basic usage of the deck.gl scripting API.
DeckGL Scripting API
To start visualizing data with WebGL, you need to initialize a DeckGL instance:
const deckgl = new deck.DeckGL(props);You can find the full documentation of the DeckGL class here. The scripting API extends the core Deck class with some additional features such as Mapbox integration.
As a start, you may want to tweak these props to your own scenario:
- container The container in which deck.gl should append its canvas. Can be either a HTMLDivElement or the element id. Default to document.body. The deck.gl canvas is resized to fill the container.
- longitude latitude zoom pitch bearing The initial view states of a geospatial visualization.
- controller By default, the Deck canvas is fully interactive — you can zoom, rotate and pan around. Set controller to false to disable interaction.
- map mapStyle mapboxApiAccessToken The scripting API offers out-of-the-box integration with Mapbox. To add a base map to your visualization, you need to include the Mapbox library and stylesheet. To disable the base map, simply exclude the mapbox script or set map to false. Specify your map style and access token as props when initiating the Deck object. See Mapbox GL JS documentation for how to use Mapbox.
Layers
Layers are pre-packaged WebGL visualizers for your data. You can quickly get impressive visual results through composition of multiple layers. Leveraging the GPU, deck.gl is able to render millions of data points in the browser smoothly. Suppose we have an array of objects {coordinates, count, address} describing geolocations where users checkin to a service. Here is a layer that renders a scatterplot from the data, each circle sized to reflect the prominence of the location:
Here is an example of updating a layer based on user-provided parameters:
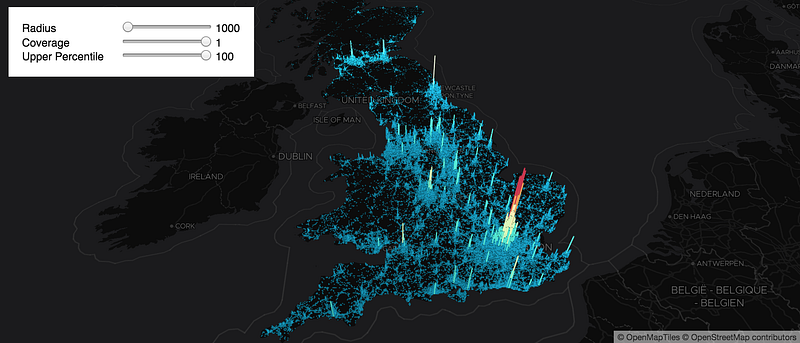
The best way to explore the extensive deck.gl layer collection is the interactive documentation in our layer catalog.
Interactions
deck.gl makes it easy to interact with objects rendered in the 3d scene. To make a layer interactive, turn on the pickable prop:
Aside from per-layer interaction, you may also listen to user events on the entire DeckGL canvas. Some useful DeckGL callback props are:
- onLayerClick called when any layer is clicked
- onLayerHover called when any layer is hovered
- onViewportChange called when the viewport is manipulated
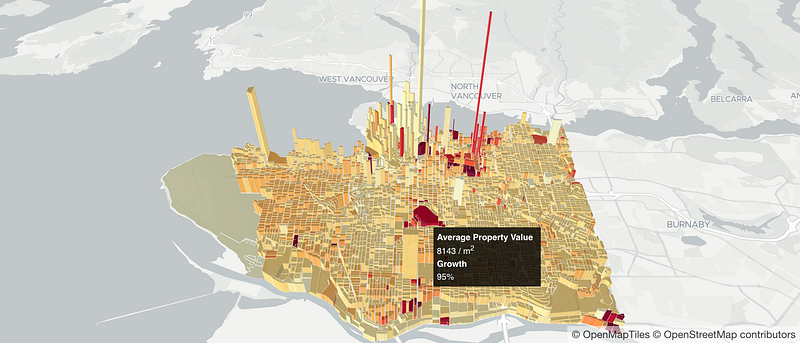
An example of showing tooltips on hover:
Not A Maps Person?
No problem, we got you covered.
By default, Deck layers use the LNGLAT coordinate system and renders into a single MapView.
If you explicitly set the views prop of your DeckGL instance, you can easily work with non-geospatial data. For example, the OrbitView is great for interactive 3d visualizations. The OrthographicView is usually used for 2d visualizations looking from top down.
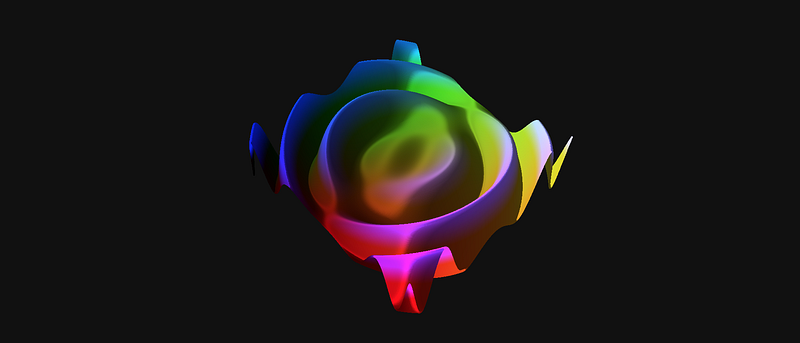
Our codepen showcase and observable profile has all sorts of examples to get you started. Welcome to deck.gl!


