
Dash, Leaflet, Interactive map in Modal box using STRAVA data on python
Welcome to our article about creating an interactive map with Python, Dash, dash-leaflet, plotly, CSS, HTML, and the Strava API.
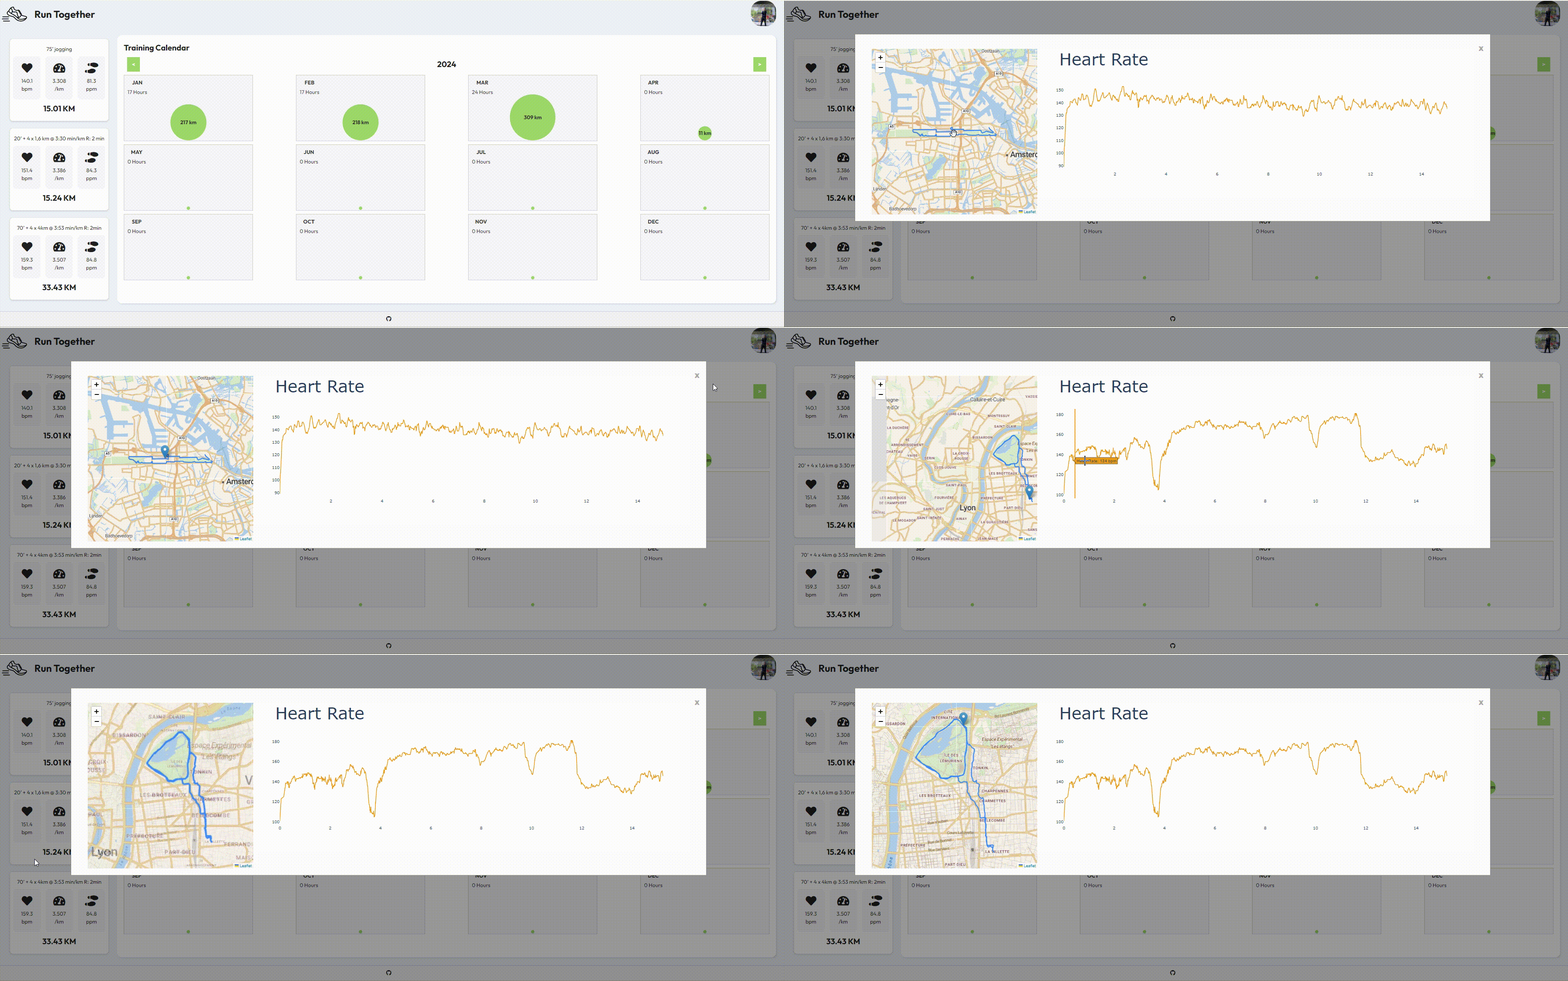
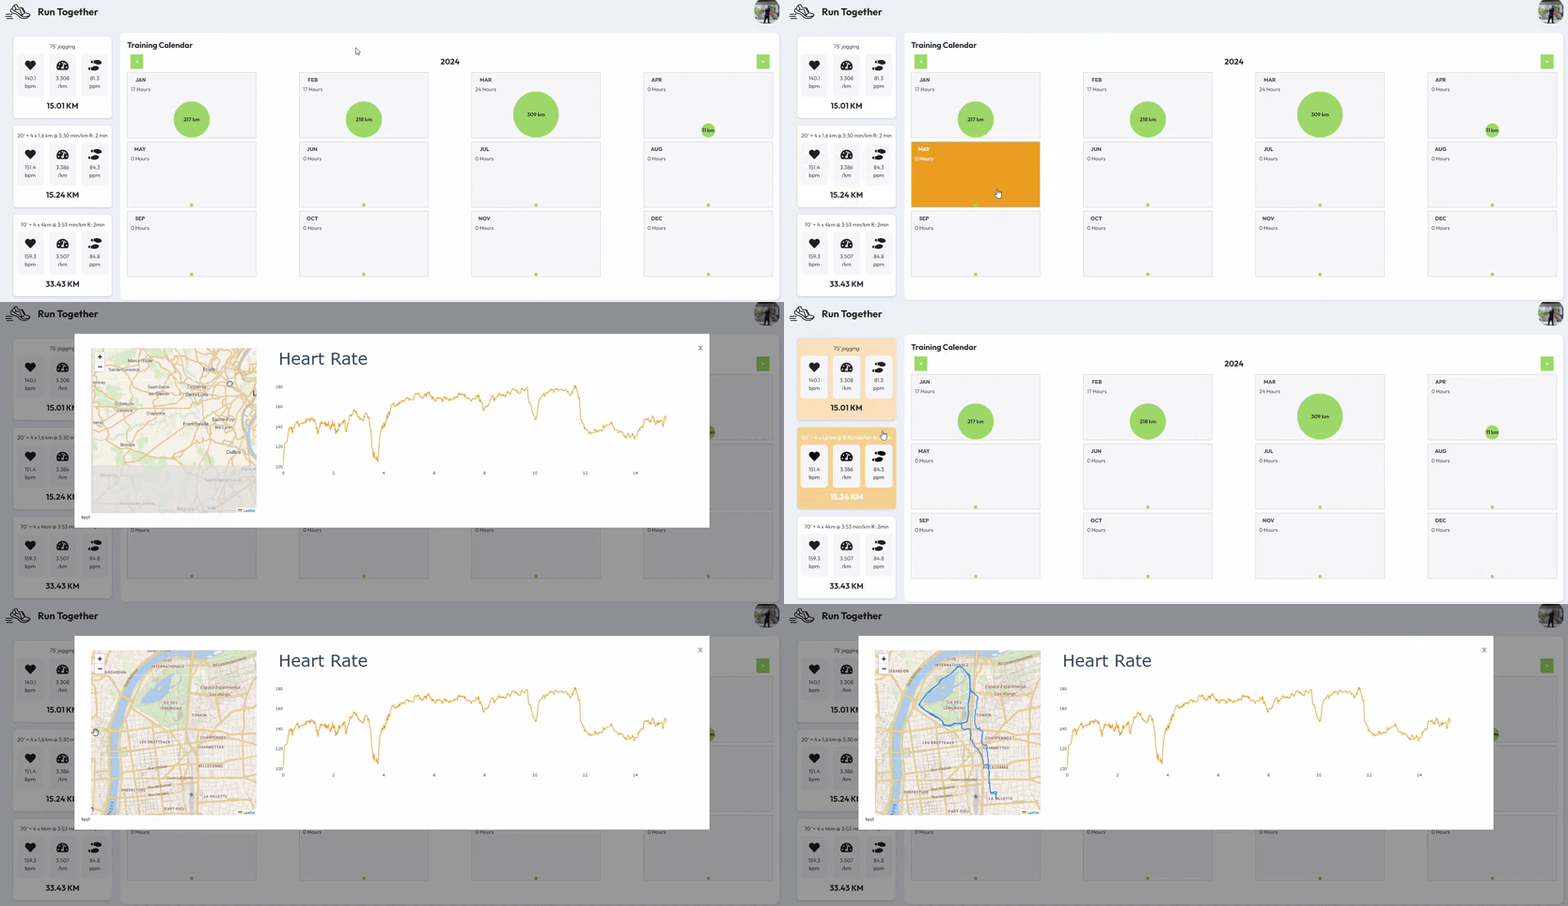
The map will be displayed within a modal component, which appears when the user chooses to view more details about a specific activity:
- Modal Box on Dash: Hidden parameter in Div component
- Stream Data calling the Strava API
- Dash Leaflet: Map Container
- Dash Leaflet: Tile Layer
- Dash Leaflet: Polyline & Boundary
- Dash Leaflet: Mutable properties
- Dash Leaflet: update by Hovering a Graph
- Summary and What’s Next
Modal Box on Dash: Hidden parameter in Div components
The objective is to enable users to open a modal box by clicking on an activity to access more details. This modal box will feature a map of the activity and heart rate information, and facilitating interaction between the two.
The hidden parameter in the Dash component allows toggling the visibility of the modal box, with the default set to hidden=True.
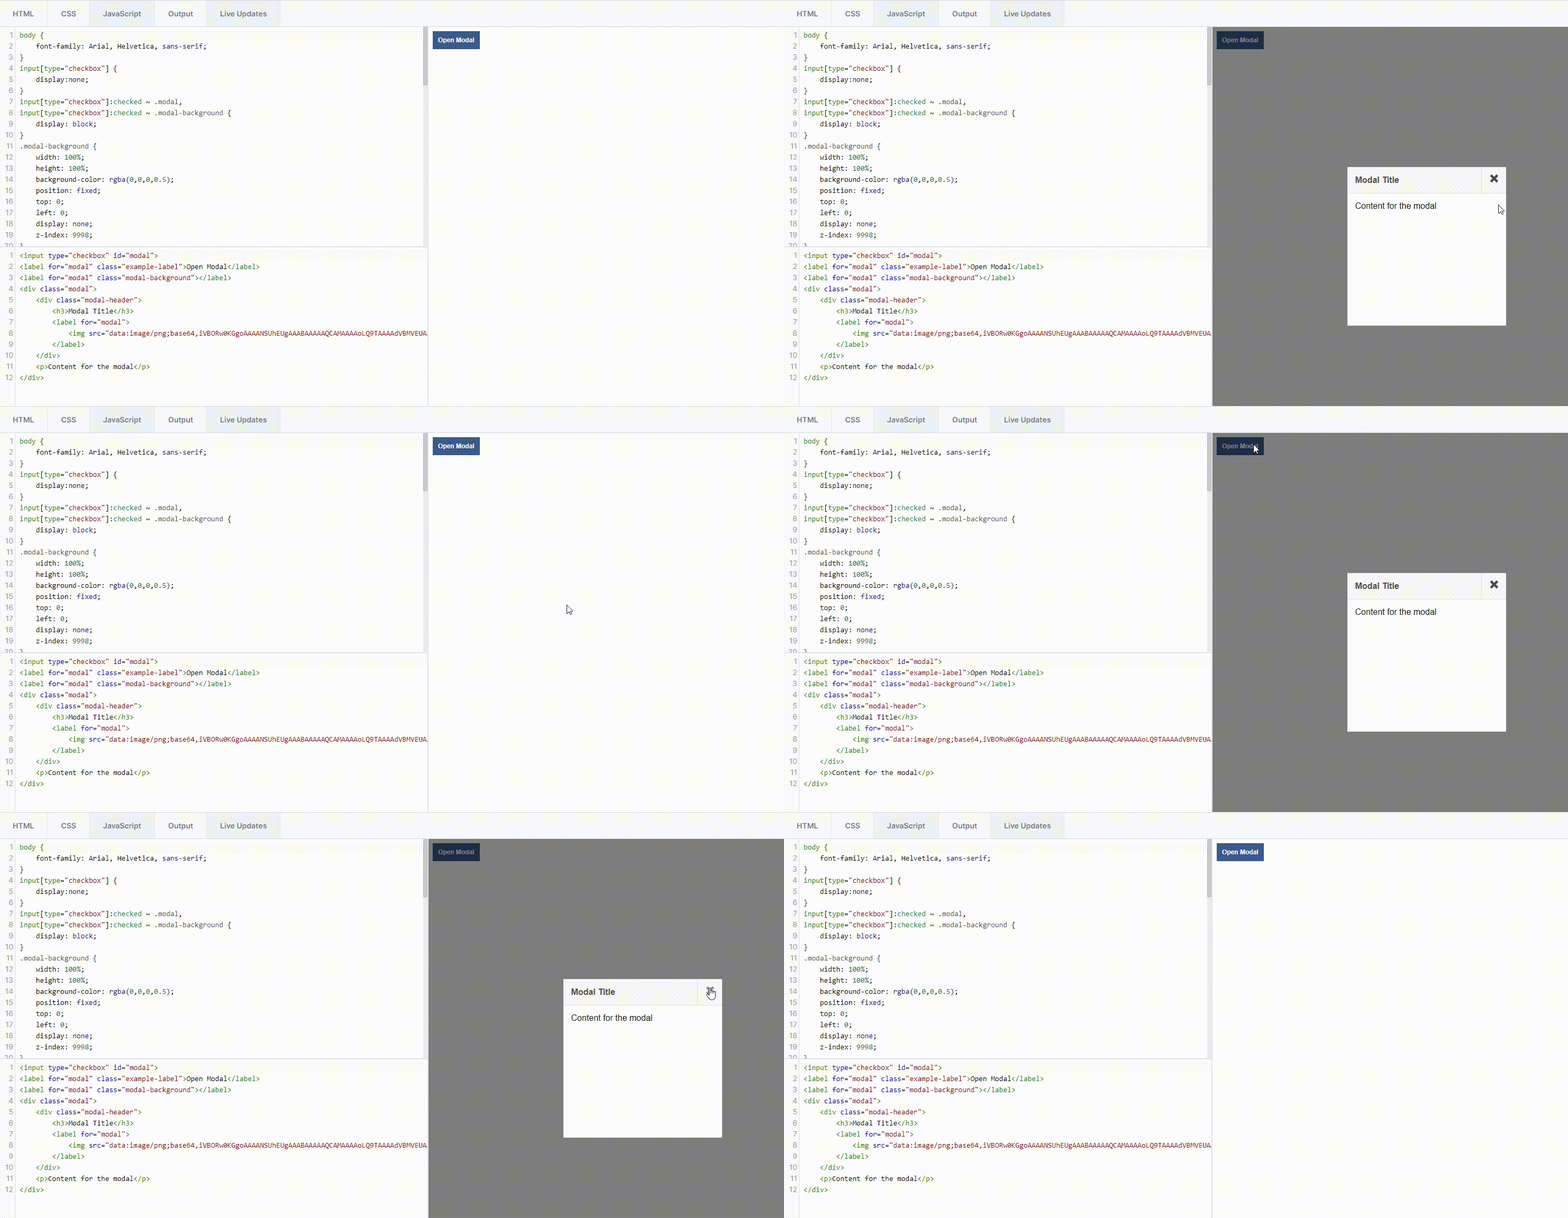
I utilized a simple example from codehack.io to create the button and the CSS style associated to themodal box. Afterwards, I just translate this HTML and CSS code into Python using the HTML library in Dash and a CSS file in my static folder of my dash application.
If you want to know more about Dash, Class Name and CSS you can read this article Header, Footer, body with Dash, CSS, and Dash HTML Component
from dash import html

def get_modal_box() -> html.Div:
    """
    Returns a modal box for displaying content.

    This function creates a modal box with a close button ("x") and an empty modal body.
    The modal box is initially hidden.

    Returns:
    html.Div: A modal box for displaying content.
    """

    # Create the modal box containing modal content
    modal_box = html.Div(
        children=[
            html.Div(
                children=[
                    # Close button for the modal box
                    html.Span(
                        children="x",
                        className="close",
                        id="close-modal-btn"
                    ),
                    # Placeholder for modal body content
                    html.Div(id="modal-body")
                ],
                # Styling for the modal content
                className="modal-content-style",
                id="modal-content"
            )
        ],
        # Styling for the modal box
        className="modal-style",
        id="modal",
        hidden=True,  # Initially hide the modal box
    )
    return modal_box
/* The Modal */
.modal-style {
/* Hidden by default */
/* The modal container */
position: fixed; /* It remains fixed in its position even when the page is scrolled */
z-index: 1; /* Set a high z-index to make sure it appears on top of other elements */
padding-top: 100px; /* Positioning the modal box */
left: 0;
top: 0;
width: 100%; /* Full width */
height: 100%; /* Full height */
overflow: auto; /* Enable scroll if the content exceeds the modal's dimensions */
background-color: rgb(0,0,0); /* Fallback color */
background-color: rgba(0,0,0,0.4); /* Black with opacity to create a semi-transparent background */
}
/* Modal Content */
.modal-content-style {
/* Styling for the content inside the modal */
background-color: #fefefe; /* Background color of the modal content */
margin: auto; /* Center the modal content horizontally */
padding: 20px; /* Padding around the modal content */
border: 1px solid #888; /* Border around the modal content */
width: 80%; /* Set the width of the modal content */
}
/* The Close Button */
.close {
/* Styling for the close button */
color: #aaaaaa; /* Default color of the close button */
float: right; /* Align the close button to the right */
font-size: 28px; /* Set the font size of the close button */
font-weight: bold; /* Set the font weight of the close button */
}
.close:hover,
.close:focus {
/* Styling for the close button on hover or focus */
color: #000; /* Change the color of the close button when hovered or focused */
text-decoration: none; /* Remove underline on hover or focus */
cursor: pointer; /* Change the cursor to pointer on hover or focus */
}Now that the component is created, we need to establish callbacks to open and close the modal box when the user interacts.
Clicking on one of the select-activity-btn buttons triggers a callback in the application, displaying the modal and updating its content. Although the modal box always exists in the layout, it’s only displayed when the hidden parameter is set to False. The callback function manipulates this parameter accordingly.
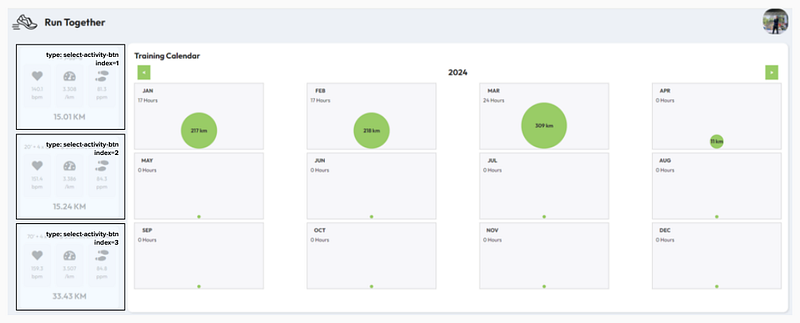
Utilizing pattern matching, we differentiate between different components using type and index inputs. By leveraging ctx.triggered_id, we capture the user’s action effectively and retrieve which button has been specifically trigger.
For further insights into managing multiple output callbacks and pattern-matching call back: Managing Multiple Output Callbacks — Python, Dash, Flask Sessions, and Callbacks — Building an Interactive Calendar with Dash
import logging
from dash import Input, Output, ctx, ALL


@dash_app.callback(
    Output("modal", "hidden"),
    Output("modal-body", "children"),
    Input({"type": "select-activity-btn", "index": ALL}, "n_clicks"),
    prevent_initial_call=True,
)
def display_modal_box(n_click):
    """
        Open the Modal box when user click on one activity
        :param n_clicks:  User Clicking on the activity
        :return: Hidden = True for the model Component
        :return: children of the modal-body which will be content of the modal
    """
    activity_id = ctx.triggered_id['index']
    logging.info(
        f"User Action: select-activity-btn. Get Activity: "
        f"id={activity_id}"
    )

    activity_map = get_activity_details(
        activity_id=activity_id
    )

   return False, [html.Div(children=f"Activity id: {activity_id}")]

@dash_app.callback(
    Output("modal", "hidden"),
    Input("close-modal-btn", "n_clicks"),
    prevent_initial_call=True,
)
def display_modal_box(n_clicks):
    """
        Clost the Modal box when user click on the cross
        :param n_clicks:  User Clicking on the cross
        :return: Hidden = True for the model Component
    """
    logging.info(
        f"User Action: close-modal-btn. Close Modal Box"
    )
    return True
Stream Data calling the Strava API
To utilize the high-frequency data recorded during your training sessions and stored in Strava, you’ll need to utilize the Stream API. Specifically, you can make a
GET request to /activities/{id}/streams.
For more details, you can refer to the documentation at https://developers.strava.com/docs/reference.
The Stream API allows you to retrieve all the data points recorded during your activity, including time, distance, latitude, longitude, heart rate, and more. You can specify the data you need by including the desired keys directly in the query.
In this scenario, the focus will be on utilizing the latitude and longitude data to render the map, while also incorporating the heart rate data to associate heart rate values with each moment of the race.
import logging
import requests

def get_activity_stream(access_token: str, activity_id: int) -> dict:
      """
          Get Activity Stream from STRAVA API:
          https://developers.strava.com/docs/reference/#api-Streams-getActivityStreams

      Returns
      -------
      Dict stream From Strava API V3 with the time, heart-rate latitude and longitude.
      """

        url = f"https://www.strava.com/api/v3/activities/{activity_id}/" \
              f"streams?keys=heartrate,latlng&key_by_type=true"

      headers = {
          "Authorization": f"Bearer {access_token}"
      }

      response = requests.get(url, headers=headers)

      if response.status_code == 200:
          activity_stream = response.json()
          return activity_stream

      else:
          logging.info(f"Error: {response.status_code} - {response.text}")
          raise Exception(f"Error: {response.status_code} - {response.text}")
If you’re interested in learning more about connecting with Strava and obtaining a Strava Access Token, you can refer to one of my previous articles titled Create a Running Dash App with Strava Authentication. In that article, I demonstrate the use of the stravalib Python library to initiate the client and facilitate token exchange. It’s important to note that the access token is only valid for a specific window of time and for a particular athlete.
I employ it within my repository through a StravaManager class, which will return a list:
{
  "latlong": {
    "type" : "distance",
    "data" : [[52.386532, 4.880029], [52.386532, 4.880029], [52.386532, 4.880029]],
    "series_type": "distance",
    "original_size": 1059,
    "resolution": "high"
},
"heartrate": {
    "type" : "distance",
    "data" :  [89, 94, 97, 100, 103, 103],
    "series_type": "distance",
    "original_size": 1059,
    "resolution": "high"
  },
}
Dash Leaflet: Map Container
Leaflet, an open-source JavaScript library, is utilized for creating interactive maps. A Python library has been developed to encapsulate Leaflet functionality into Dash components: https://www.dash-leaflet.com/.
Dash Leaflet is a wrapper of Leaflet, the leading open-source JavaScript library for interactive maps. The syntax is similar to other Dash components, with naming conventions following React-Leaflet.
The typical method of displaying a map involves centering it around a specific point defined by latitude and longitude coordinates, along with a specified zoom level. You can refer to a tutorial on this zoom properties here: https://leafletjs.com/examples/zoom-levels/example-delta.html.
import dash_leaflet as dl

dl.Map(
  dl.TileLayer(),
  center=[56,10],
  zoom=6,
  style={'width': '500px', 'height': '500px'}
)
Dash Leaflet: Tile Layer
You have the flexibility to incorporate various map styles into your application by specifying the Tile Layer. A tile layer is a data layer that can access and display tiles (rectangular sections) into a continuous layer. These tiles are either raster image tiles or vector tiles that are generated into a tile cache before being made available for use.
The
TileLayercomponent draws the map tiles. Per default, free OSM tiles are used, but the tile provider can easily be changed via theurlproperty. You could even make your own tiles,
Numerous paid tile options are available, but you can also discover several free alternatives on the following website: https://leaflet-extras.github.io/leaflet-providers/preview/.
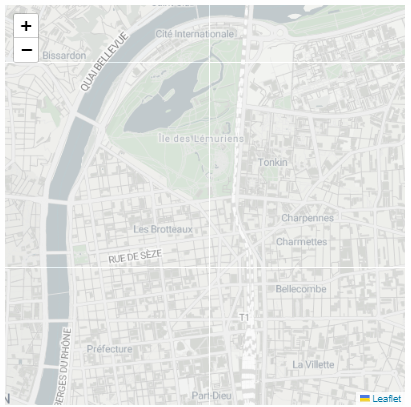
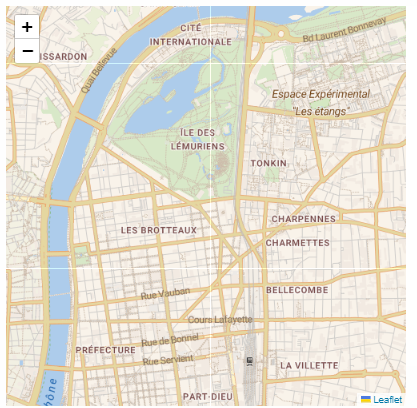
Next, you simply need to integrate this URL into your application, and if necessary, include the associated token for those not freely available. In this instance, we’ll utilize the outdoors tile from Stadiamaps.
import dash_leaflet as dl

# Define the URL for the tile layer, including placeholders for zoom level, x-coordinate, y-coordinate, and any additional parameters
url = "https://tiles.stadiamaps.com/tiles/outdoors/{z}/{x}/{y}{r}.png"

# Create a map component with specified style and bounds
activity_map = dl.Map(
    style={'width': '500px', 'height': '500px'},  # Set the width and height of the map
    center=[56,10], # coordinate of the center of the map
    zoom=6, # zoom level
    children=[  # Define child components of the map
        dl.TileLayer(
            url=url,
        ),
    ]
)
Dash Leaflet: Polyline & Boundary
The subsequent action involves showing a road or race route on the map. To achieve this, integrate the polyline within the children component of your map. The Polyline is a dash-leaflet object / component which allow to draw polyline overlays on the map.
Given that the zoom level and center might vary based on the training activities, it’s advantageous to utilize an interactive approach to ensure optimal visualization at all times.
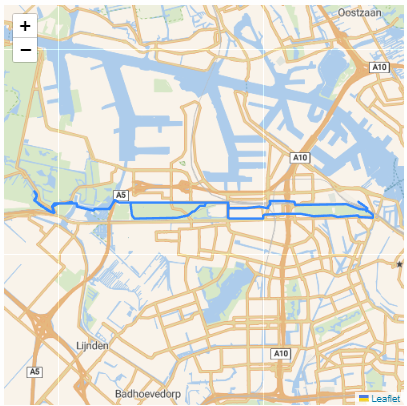

Instead of relying on the center and zoom parameters, you can utilize the bounds parameter within the dl.Map component. This approach ensures that the map displays the optimal center and zoom level based on the specified bounds parameter.
In our scenario, we aim to display the route from our activity stream on the map. Therefore, we require the maximum and minimum latitude and longitude coordinates for this particular training as minimum boundary.
import dash_leaflet as dl

# Boundaries of the map based on the minimum and maximum lat and lon coordinates
min_latitude = min([x[0] for x in activity_stream['latlng']['data']])
max_latitude = max([x[0] for x in activity_stream['latlng']['data']])
min_longitude = min([x[1] for x in activity_stream['latlng']['data']])
max_longitude = max([x[1] for x in activity_stream['latlng']['data']])

# Define the bounding points for the map, the southwest and northeast corners
bounds_points = [
    [min_latitude, min_longitude],  # South West corner
    [max_latitude, max_longitude]  # North East corber
]

# Define the URL for the tile layer, including placeholders for zoom level, x-coordinate, y-coordinate, and any additional parameters
url = "https://tiles.stadiamaps.com/tiles/outdoors/{z}/{x}/{y}{r}.png"

# Create a map component with specified style and bounds
activity_map = dl.Map(
    style={'width': '500px', 'height': '500px'},  # Set the width and height of the map
    bounds=bounds_points,  # Set the initial bounds of the map
    children=[  # Define child components of the map
        dl.TileLayer(
            url=url,
        ),
        dl.Polyline(
               positions=activity_stream['latlng']['data'],
        ),
    ]
)
Dash Leaflet: Mutable properties
Once the map is initialized, not all of its options can be modified.
The React Leaflet library introduces the concept of mutable and immutable properties. Mutable properties can be changed after a component has been constructed (e.g. in Dash via a callback), while immutable cannot. If you find yourself in need of changing an immutable property, you should instead recreate the component with the immutable prop(s) set accordingly.
For instance, in our scenario, if we’re utilizing the same map container in our function, this approach would be applicable.
import dash_leaflet as dl

Py
def get_activity_map(activity_id: int, activity_stream: dict) -> dl.Map:
    """
        Return the Activity Map

    :param activity_id:
    :param activity_stream:
    :return: dl.Map ot the activity
    """

    # Boundaries of the map based on the minimum and maximum lat and lon coordinates
    min_latitude = min([x[0] for x in activity_stream['latlng']['data']])
    max_latitude = max([x[0] for x in activity_stream['latlng']['data']])
    min_longitude = min([x[1] for x in activity_stream['latlng']['data']])
    max_longitude = max([x[1] for x in activity_stream['latlng']['data']])

    # Define the bounding points for the map, the southwest and northeast corners
    bounds_points = [
        [min_latitude, min_longitude],  # South West corner
        [max_latitude, max_longitude]  # North East corber
    ]

    # Define the URL for the tile layer, including placeholders for zoom level, x-coordinate, y-coordinate, and any additional parameters
    url = "https://tiles.stadiamaps.com/tiles/outdoors/{z}/{x}/{y}{r}.png"

    # Create a map component with specified style and bounds
    activity_map = dl.Map(
        style={'width': '500px', 'height': '500px'},  # Set the width and height of the map
        bounds=bounds_points,  # Set the initial bounds of the map
        children=[  # Define child components of the map
            dl.TileLayer(
                url=url,
            ),
        ]
    )

    activity_map = dl.Map(
        style={'width': '500px', 'height': '500px'},  # Set the width and height of the map
        bounds=bounds_points,  # Set the initial bounds of the map
        children=[
            # Define the Style of the map
            dl.TileLayer(
                url=url,
            ),
            # Set the positions for the polyline
            dl.Polyline(
                   positions=activity_stream['latlng']['data'],
            ),
        ]
    )

    return activity_map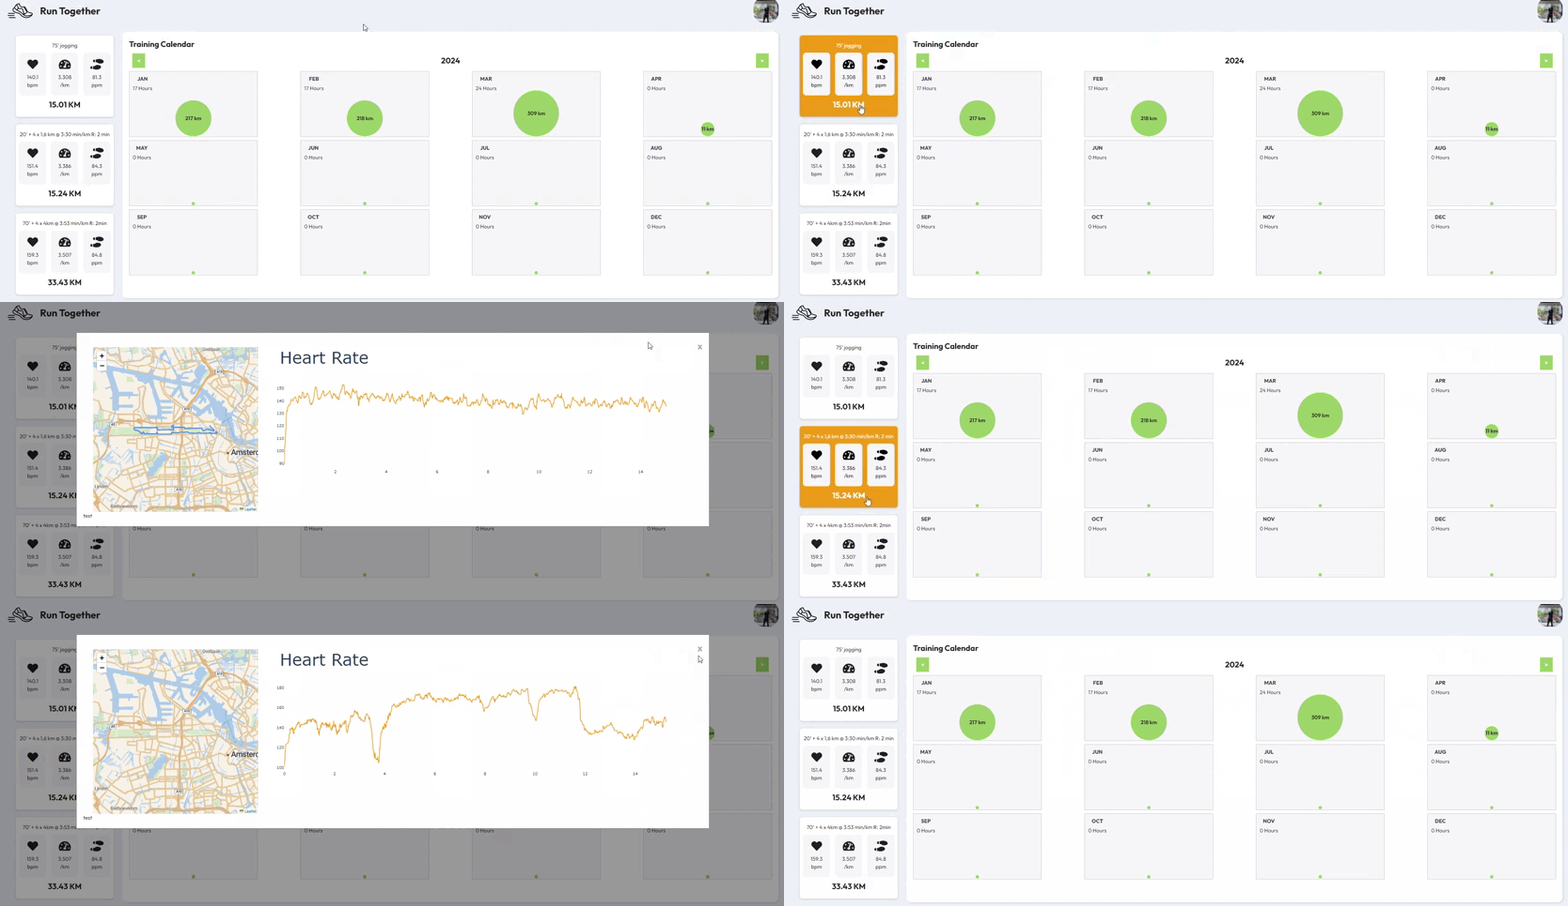
We end up with only one object even when calling this function multiple times in a Dash callback. Initially, it initializes the bounds, which then cannot be adjusted thereafter.
This underscores the importance of assigning a unique ID to each map associate to a specific activity by using pattern matching.
As previously indicated, for further insights into managing multiple output callbacks and pattern-matching call back: Managing Multiple Output Callbacks — Python, Dash, Flask Sessions, and Callbacks — Building an Interactive Calendar with Dash.
Introducing a distinct ID for each activity on our map ensures that each map possesses different immutable parameters.
import dash_leaflet as dl


def get_activity_map(activity_id: int, activity_stream: dict) -> dl.Map:
    """
        Return the Activity Map

    :param activity_id:
    :param activity_stream:
    :return: dl.Map ot the activity
    """

    # Boundaries of the map based on the minimum and maximum lat and lon coordinates
    min_latitude = min([x[0] for x in activity_stream['latlng']['data']])
    max_latitude = max([x[0] for x in activity_stream['latlng']['data']])
    min_longitude = min([x[1] for x in activity_stream['latlng']['data']])
    max_longitude = max([x[1] for x in activity_stream['latlng']['data']])

    # Define the bounding points for the map, the southwest and northeast corners
    bounds_points = [
        [min_latitude, min_longitude],  # South West corner
        [max_latitude, max_longitude]  # North East corber
    ]

    # Define the URL for the tile layer, including placeholders for zoom level, x-coordinate, y-coordinate, and any additional parameters
    url = "https://tiles.stadiamaps.com/tiles/outdoors/{z}/{x}/{y}{r}.png"

    # Create a map component with specified style and bounds
    activity_map = dl.Map(
        style={'width': '500px', 'height': '500px'},  # Set the width and height of the map
        bounds=bounds_points,  # Set the initial bounds of the map
        children=[  # Define child components of the map
            dl.TileLayer(
                url=url,
            ),
        ]
    )

    activity_map = dl.Map(
        style={'width': '500px', 'height': '500px'},  # Set the width and height of the map
        id={  # Create a unique ID for the map using the activity ID
            "type": "activity-map",
            "index": activity_id
        },
        bounds=bounds_points,  # Set the initial bounds of the map
        children=[
            # Define the Style of the map
            dl.TileLayer(
                url=url,
            ),
            # Set the positions for the polyline
            dl.Polyline(
                   positions=activity_stream['latlng']['data'],
            ),
        ]
    )

    return activity_map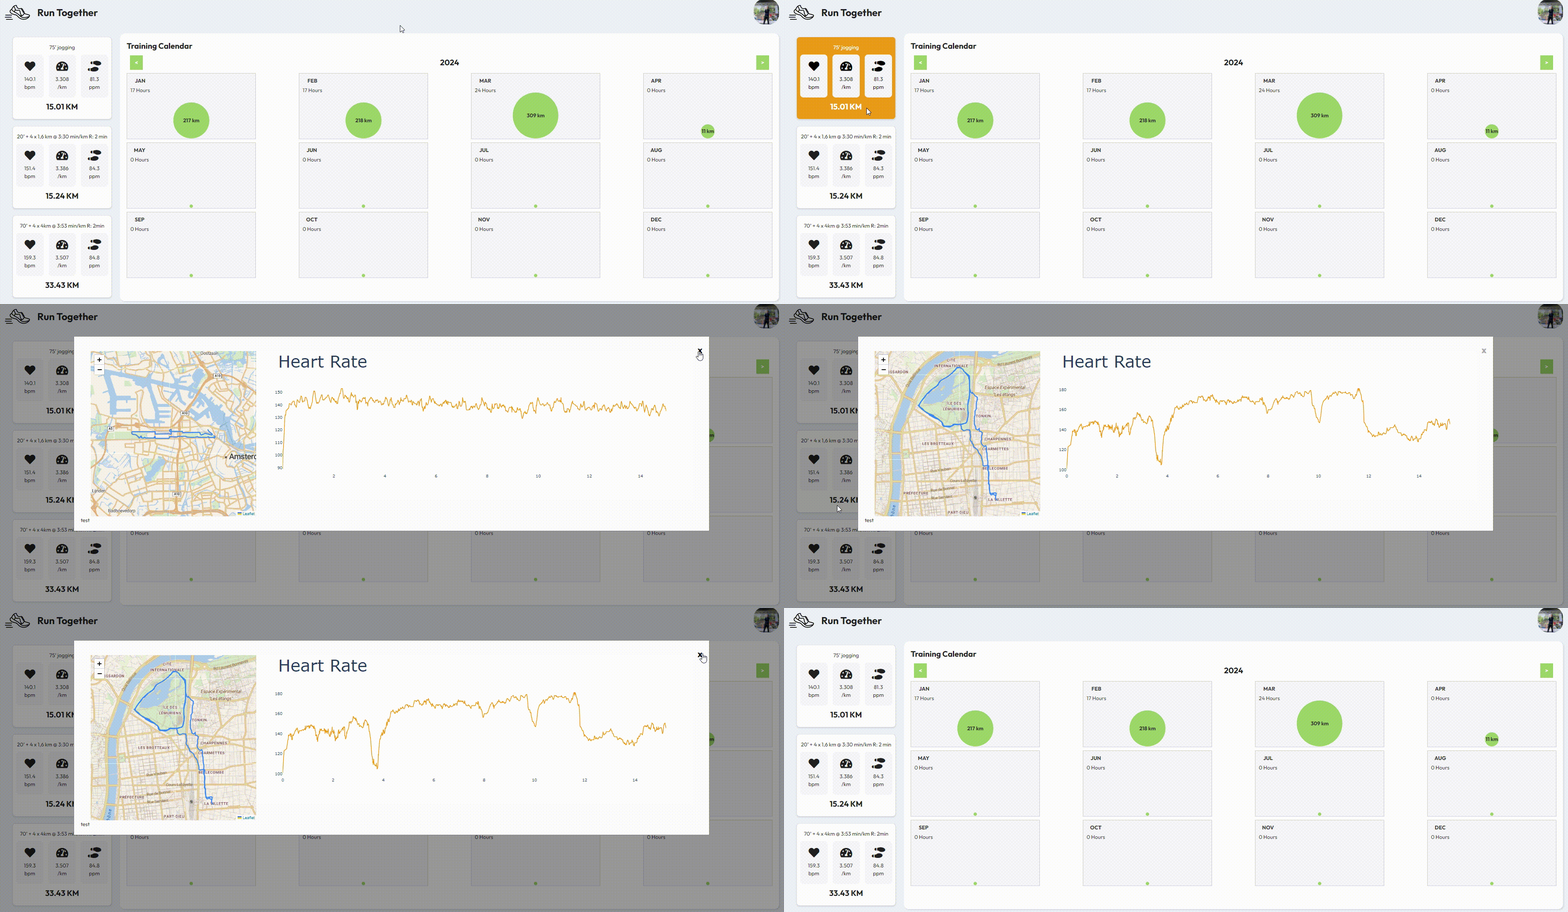
In our scenario, since the center and zoom settings cannot be altered, if a user clicks on one activity and navigates the map by adjusting the center, the settings will remain unchanged the next time the user clicks on the same activity.
Since map options are immutable, it is not possible to manipulate the viewport of the MapContainer after initialization via the zoom/center/bounds properties. To enable viewport manipulation from Dash, a special viewport property has been added. Here is a small example, where the zoom/center is changed using the flyTo transition,
import dash_leaflet as dl

def get_activity_map(activity_id: int, activity_stream: dict) -> dl.Map:
    """
        Return the Activity Map

    :param activity_id:
    :param activity_stream:
    :return: dl.Map ot the activity
    """

    # Boundaries of the map based on the minimum and maximum lat and lon coordinates
    min_latitude = min([x[0] for x in activity_stream['latlng']['data']])
    max_latitude = max([x[0] for x in activity_stream['latlng']['data']])
    min_longitude = min([x[1] for x in activity_stream['latlng']['data']])
    max_longitude = max([x[1] for x in activity_stream['latlng']['data']])

    # Define the bounding points for the map, the southwest and northeast corners
    bounds_points = [
        [min_latitude, min_longitude],  # South West corner
        [max_latitude, max_longitude]  # North East corber
    ]

    # Define the URL for the tile layer, including placeholders for zoom level, x-coordinate, y-coordinate, and any additional parameters
    url = "https://tiles.stadiamaps.com/tiles/outdoors/{z}/{x}/{y}{r}.png"

    # Create a map component with specified style and bounds
    activity_map = dl.Map(
        style={'width': '500px', 'height': '500px'},  # Set the width and height of the map
        bounds=bounds_points,  # Set the initial bounds of the map
        children=[  # Define child components of the map
            dl.TileLayer(
                url=url,
            ),
        ]
    )

    activity_map = dl.Map(
        style={'width': '500px', 'height': '500px'},  # Set the width and height of the map
        id={  # Create a unique ID for the map using the activity ID
            "type": "activity-map",
            "index": activity_id
        },
        bounds=bounds_points,  # Set the initial bounds of the map
        children=[
            # Define the Style of the map
            dl.TileLayer(
                url=url,
            ),
            # Set the positions for the polyline
            dl.Polyline(
                   positions=activity_stream['latlng']['data'],
            ),
        ]
    )

    # Set the viewport of the activity map to the specified bounds
    # with a transition effect of flying to the bounds.
    activity_map.viewport = dict(
        bounds=bounds_points,
        transition="flyToBounds"
    )

    return activity_map
Dash Leaflet: update by Hovering a Graph
Alright, let’s consolidate all the components and information we’ve previously discussed: the modal component, the callback, and the map.
We’ll include a graph displaying the heart rate within the body of the modal component. We’ll gather all these different elements within the get_activity_details function, which will be called in the modal component callback when the user selects an activity to view its details.
from typing import Union, Dict
from dash.html import Span, Div
from dash import html
import plotly.graph_objects as go
from dash import dcc
import dash_leaflet as dl


def get_activity_map(activity_id: int, activity_stream: dict) -> dl.Map:
    """
        Return the Activity Map

    :param activity_id:
    :param activity_stream:
    :return: dl.Map ot the activity
    """

    # Manage the size of the map
    min_latitude = min([x[0] for x in activity_stream['latlng']['data']])
    max_latitude = max([x[0] for x in activity_stream['latlng']['data']])
    min_longitude = min([x[1] for x in activity_stream['latlng']['data']])
    max_longitude = max([x[1] for x in activity_stream['latlng']['data']])

    bounds_points = [
        [min_latitude, min_longitude],  # South West
        [max_latitude, max_longitude]  # North East
    ]

    # https://leaflet-extras.github.io/leaflet-providers/preview/
    url = "https://tiles.stadiamaps.com/tiles/outdoors/{z}/{x}/{y}{r}.png"


    activity_map = dl.Map(
        style={'width': '500px', 'height': '500px'},
        id={
            "type": "activity-map",
            "index":  activity_id
        },
        bounds=bounds_points,
        children=[
            dl.TileLayer(
                url=url,
            ),
            dl.Polyline(
                positions=activity_stream['latlng']['data'],
            ),
            dl.LayerGroup(
                id="marker-map",
                children=[
                ]
            )
        ]
    )

    activity_map.viewport = dict(
        bounds=bounds_points,
        transition="flyToBounds"
    )

    return activity_map


def get_graph_heart_rate(activity_stream: Dict) -> dcc.Graph:
    """
    Generate a heart rate graph.

    This function creates a heart rate graph based on the provided activity
    stream data,displaying heart rate values over distance.
    The graph is customized with specificstyling and hover interactions.

    :param activity_stream: Dictionary containing activity stream data.
    :return: dcc.Graph component representing the heart rate graph.
    """
    # Create a new Plotly figure
    fig = go.Figure()

    # Add heart rate data as a scatter plot
    fig.add_trace(
        go.Scatter(
            x=[x / 1000 for x in activity_stream['distance']['data']],  # Convert distance to km
            y=activity_stream['heartrate']['data'],
            mode='lines',
            line=dict(color="#F39C12"),
            hovertemplate='Heart Rate: %{y} bpm<extra></extra>',  # Hover tooltip template
        )
    )

    # Customize layout of the graph
    fig.update_layout(
        title=dict(
            text="Heart Rate",
            font=dict(size=50),
        ),
        plot_bgcolor='rgba(0,0,0,0)'  # Set plot background color
    )

    # Customize x-axis appearance
    fig.update_xaxes(
        showspikes=True,
        spikecolor="#F39C12",
        spikesnap="cursor",
        spikemode="across",
        spikedash="solid",
    )

    # Return dcc.Graph component with the generated figure
    return dcc.Graph(
        figure=fig,
        config={'displayLogo': False, 'displayModeBar': False},  # Disable display of logo and mode bar
        responsive=True,  # Enable responsiveness                                                                                                  responsive=True,  # Enable responsiveness
        id="activities-graph"  # Set component ID
    )


def get_activity_details(activity_id: int) -> list[Union[Span, Div]]:
    """
    Retrieve activity details.

    This function retrieves activity details for a given activity ID,
    including the activity stream, activity map, heart rate graph,
    and grid layout for displaying map and graph components.

    :param activity_id: ID of the activity.
    :return: List containing HTML components for activity details.
    """
    # Retrieve activity stream data
    activity_stream = get_activity_stream(activity_id=activity_id)

    # Get activity map component
    activity_map = get_activity_map(
        activity_id=activity_id,
        activity_stream=activity_stream
    )

    # Get heart rate graph component
    heart_rate_graph = get_graph_heart_rate(
        activity_stream=activity_stream
    )

    # Create grid layout for displaying map and graph components
    grid = html.Div(
        children=[
            html.Div(
                className="activities-map-container",
                children=activity_map
            ),
            html.Div(
                className="activities-graph-container",
                children=heart_rate_graph,
            ),
            # store the activity stream in a dash component to be used in the callbacl
            dcc.Store(id='activity-stream', data=activity_stream)
        ],
        className="grid-activity-map-plot",  # CSS class for styling
    )

    # Return list of HTML components for activity details
    return [
        html.Br(),
        html.Div(children=f"Activity id: {activity_id}"),
        grid,
        html.Div(
            id="hover",
            children="test"
        ),
    ]
import logging
from dash import Input, Output, ctx, ALL
@dash_app.callback(
Output("modal", "hidden"),
Output("modal-body", "children"),
Input({"type": "select-activity-btn", "index": ALL}, "n_clicks"),
prevent_initial_call=True,
)
def display_modal_box(n_click):
"""
Open the Modal box when user click on one activity
:param n_clicks: User Clicking on the activity
:return: Hidden = True for the model Component
:return: children of the modal-body which will be content of the modal
"""
activity_id = ctx.triggered_id['index']
logging.info(
f"User Action: select-activity-btn. Get Activity: "
f"id={activity_id}"
)
activity_details_modal_content = get_activity_details(
activity_id=activity_id
)
return False, activity_details_modal_content
You might have observed the inclusion of two new elements:
The LayerGroup within the dl.Map:
- The
LayerGroupcomponent acts as a container for organizing other components within the map. Often, it serves as a designated area for callbacks to target. In our context, theLayerGroupnamedmarker-mapis configured to hold markers representing activity points associated with the user's hover action on the graph.
The dcc.Store within the grid-activity-map-plot div:
- The
dcc.Storecomponent is utilized to store JSON data directly in the browser. In our instance, it enables the retrieval of latitude and longitude information corresponding to the user's hover action. As the graph contains only heart rate and index data from the activity stream, this store ensures efficient retrieval of additional essential data.
To establish interaction between the dcc.Graph and the dl.Map, ensuring that markers are displayed on the map , several steps are integrated into the code. We create the callback display_hover_data, which updates the LayerGroup when a user hovers over the activities-graph using the dcc.Store.
dash_app.callback(
    Output('marker-map', 'children'),
    Input('activities-graph', 'hoverData'),
    Input('activity-stream', 'data'),
    prevent_initial_call=True,
)
def display_hover_data(hover_data, activity_stream):
    # Get the Index of the point selected by the hover
    index = hover_data['points'][0]["pointIndex"]

    # Get the data store in the DCC Store component in get_activity_details
    position = activity_stream['latlng']['data'][index]

    # return the Marker display the marker-map LayerGroup in map container
    return [dl.Marker(position=position)]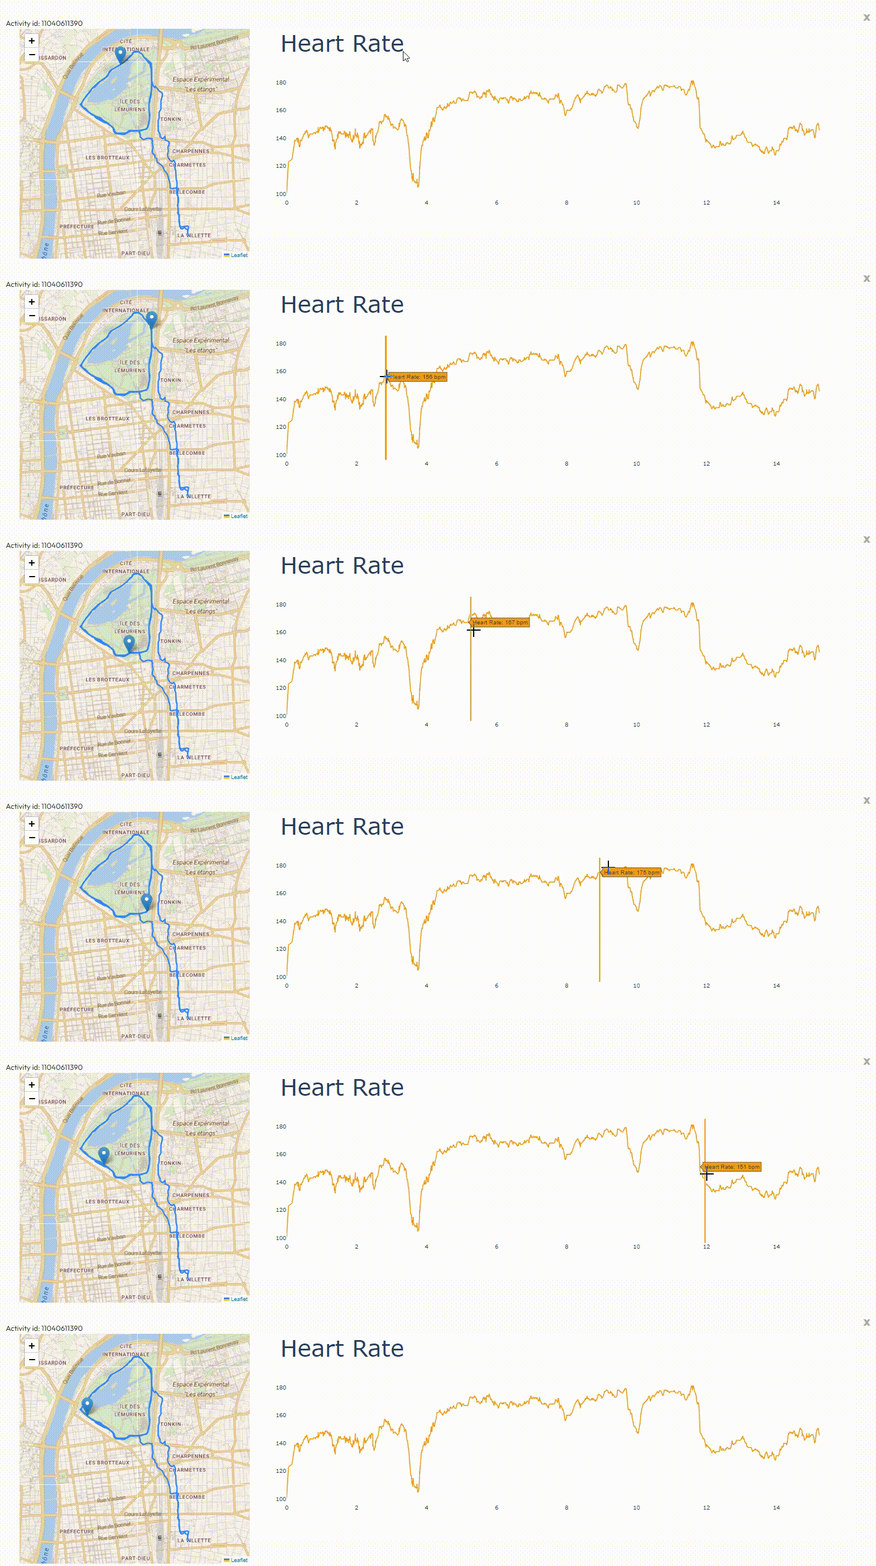
The display_hover_data callback is pivotal in this interaction. Triggered by hovering over the dcc.graph (activities-graph), it retrieves the hover data to ascertain the index of the selected point. With this index, it retrieves the corresponding position data from the activity_stream. Subsequently, a dl.Marker is created at this position and returned to update the marker-map LayerGroup, displaying the marker on the map.
In essence, through these components and callbacks, a seamless interaction is achieved between the dcc.graph and the dl.map, enhancing user experience by visually representing activity points on the map in real-time as users interact with the graph.
Summary and What’s Next
In this article, we explored how to create an interactive map using Python, Dash, dash-leaflet, plotly, CSS, HTML, and the Strava API. By integrating a modal component, retrieving data from the Strava API, and incorporating hover interactions between a graph and the map, we’ve demonstrated a comprehensive approach to visualizing activity details.
- Modal Interaction: Implementing modal components allows for a user-friendly way to display additional details, such as activity maps and heart rate graphs, enhancing the overall user experience.
- Strava API Integration: Leveraging the Strava API enables access to high-frequency data recorded during training sessions, including latitude, longitude, and heart rate information, enriching the visualization of activity routes.
- Pattern-Matching Callbacks: Utilizing pattern-matching callbacks in Dash facilitates efficient handling of user interactions, such as selecting specific activities to view detailed information, ensuring smooth application functionality.
- Immutable Properties: Understanding the concept of mutable and immutable properties in Dash Leaflet is crucial for dynamically updating map components, such as adjusting viewport bounds based on activity data.
- Real-Time Interaction: Enabling real-time interaction between a graph displaying heart rate data and a map showing activity routes enhances user engagement by providing immediate visual feedback as users explore activity details.
All the code used in this article is available on my GitHub: Matthieu Ru: https://github.com/MatthieuRu/run-together Future Unicorn


