
How to Calculate the Daily Returns And Volatility of a Stock with Python
Let’s practice with Pfizer and Moderna stocks’ performance during this pandemic.

“Bubble market crash”, “Crypto krach”, “Recession”…If you are a stock investor, chances are high you are often checking your portfolio these last weeks. Global stock markets are going down in 2022 due to many factors: the Ukraine war, inflation, oil price rise, and rising interest rates among others.
This is the perfect opportunity to start leveling up our skills with stock data with Python.
Disclaimer: The purpose of this blog post is only to show how to calculate the daily returns and volatility of a stock. There is no investment advice or promotion for any stock.
Content:
- The use case
- Required Python libraries
- Retrieve stock data with yfinance
- Calculating and plotting daily returns
- Calculate the daily, monthly, and annually volatility of a stock
- Conclusion
1. The use case
The Covid-19 pandemic has provoked dramatic changes in the world. Stock markets are no exception to that. Thanks to the mRNA vaccines, Moderna and Pfizer have become household names and saw their revenues boosted.
What are the daily returns and volatility for these 2 companies’ stocks over that period?
This will give us an indication of their level of risk. The higher the volatility, the riskier it is.
2. Required Python libraries
First, let’s import the libraries we need.
import pandas as pd
import numpy as np
import matplotlib.pyplot as plt
import yfinance as yf
yfinance is a free and open-source Python library created by Ran Aroussi. You can find more information about it here. I recommend using it to start playing with stock data.
3. Retrieve stock data with yfinance
It’s straightforward.
- To retrieve stock data, I need to use the respective ticker symbols for Pfizer and Moderna: PFE, MRNA
- Then I indicate the period with the download method.
Example with Pfizer stock
ticker= "pfe"
pfizer = yf.download(ticker, start="2020-01-01", end="2022-06-17")
pfizer.head()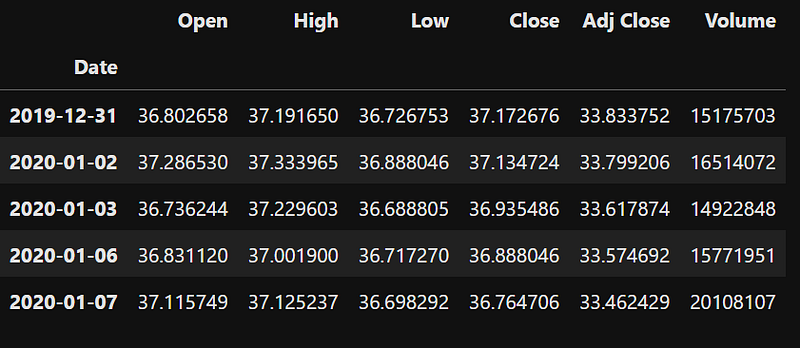
4. Calculating and plotting daily returns
Stock daily returns indicate the gain or loss per day for a given stock. We get it by subtracting the opening price from the closing price.
Conveniently, Pandas has the pct_change method to calculate the percentage of changes in the daily returns. Let’s use it and store it in a new column “daily_returns”.
Let’s start with Pfizer:
pfizer['daily_returns']=(pfizer['Close'].pct_change())*100As usual, I prefer plotting the results so it’s easier to visualize.
pfizer.dropna(inplace=True)fig,ax=plt.subplots(figsize=(12,6))
ax.spines[['top','right','left','bottom']].set_visible(False)
plt.plot(pfizer['daily_returns'], label = 'Daily Returns')
plt.legend(loc='best')
plt.title('Pfizer Stock Daily Returns Over Time')
plt.show()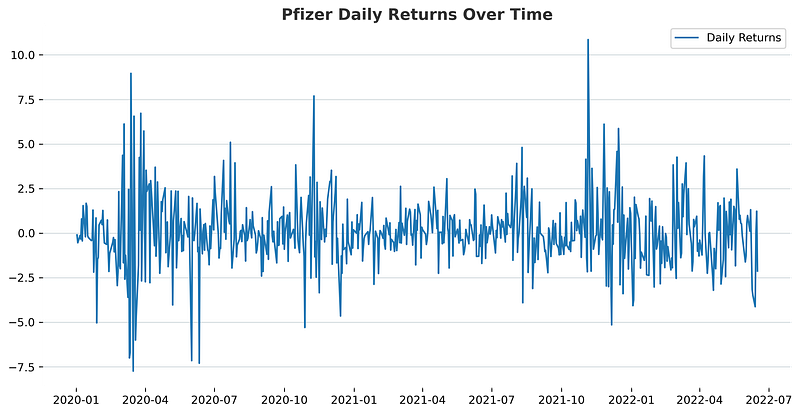
Due to Covid-19, Pfizer stock oscillation was very strong in 2020 and got less pronounced in 2021 thanks to the Covid vaccines. We can see at the end of 2021 positive daily returns linked to Omicron variant appearance. This plot helps us to monitor the magnitude of the daily change over time.
Now let’s do the same with Moderna and see how its daily returns plot looks like on the same period:
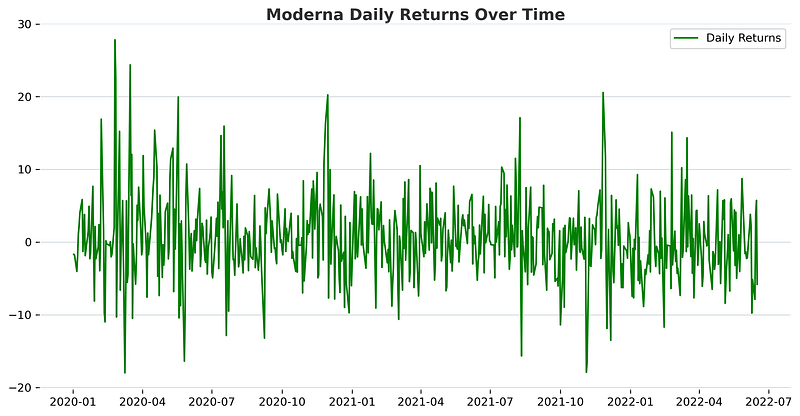
The oscillations have a higher magnitude on the positive side. From January-22, we observe that the daily returns are more on the negative side. This corresponds to a decrease in the stock price.
5. Calculate the daily, monthly, and annually volatility of a stock
A stock’s volatility is the variation in its price over a period of time.
Daily volatility: to get it, we calculate the standard deviation of the daily returns. As a reminder, the standard deviation helps us to see how much the data is spread around the mean or average.
Monthly volatility: we make the assumption that there are 21 trading days in the month so we multiply the daily volatility by the square root of 21.
Annual volatility: we assume there are 252 trading days in a calendar year and we multiply the daily volatility by the square root of 252.
Here is the code below:
import math
daily_volatility_pfe = pfizer['daily_returns'].std()
print('Daily volatility:')
print('Pfizer: ', '{:.2f}%'.format(daily_volatility_pfe))
daily_volatility_mrna = moderna['daily_returns'].std()
print('Moderna: ', '{:.2f}% \n'.format(daily_volatility_mrna))
monthly_volatility_pfe = math.sqrt(21) * daily_volatility_pfe
print('Monthly volatility:')
print ('Pfizer: ', '{:.2f}%'.format(monthly_volatility_pfe))
monthly_volatility_mrna = math.sqrt(21) * daily_volatility_mrna
print ('Moderna: ', '{:.2f}%\n '.format(monthly_volatility_mrna))annual_volatility_pfe = math.sqrt(252) * daily_volatility_pfe
print('Annual volatility:')
print ('Pfizer: ', '{:.2f}%'.format(annual_volatility_pfe ))
annual_volatility_mrna = math.sqrt(252) * daily_volatility_mrna
print ('Moderna: ', '{:.2f}%'.format(annual_volatility_mrna ))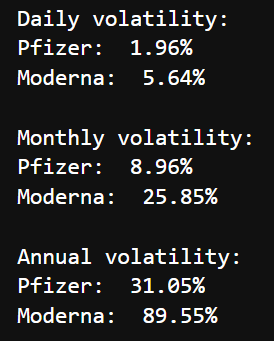
Moderna stock had very high volatility: 90% annual and 26% monthly! This shows that investors have difficulty gauging the company as its revenue is for now based on Covid-19 vaccines. They are waiting to see if its potential will materialize.
Pfizer’s one on annual basis is 31% which is lower than Moderna but still significant. Pfizer is a huge pharma company with a lot of history.
6. Conclusion
It’s easy and accessible to get stock data and do some first calculations to evaluate the risk. The example of Moderna and Pfizer stocks shows how careful we need to be when investing in stocks. I will treat other metrics in future blog posts.
Thanks for reading me! Hit the follow button to read my future posts if you like them.
You can also find me on LinkedIn here.


