
Creating the biggest climate temperature dataset in 7 minutes
Using Berkeley Earth data, python and beautifulsoup
Climate change is one of the most pressing issues facing our planet today. In order to understand and address this issue, it is essential to have access to accurate and comprehensive data on global temperatures and other climate-related factors. This is where the Berkeley Earth dataset comes in.
Berkeley Earth is an organization that has been collecting and analyzing temperature data from around the world for over a decade. They have compiled an extensive dataset that includes temperature records from over 39,000 weather stations in more than 180 countries. This dataset is widely considered to be one of the most accurate and comprehensive sources of climate data available.
What’s the main problem? Data is split for each country.
I found a dataset in Kaggle containing the historical temperature data of Earth Berkeley for all countries, however, it only contained records until 2014. Knowing that Berkeley Earth data is licensed under Creative Commons BY-NC 4.0 International and thus can be used for non-commercial use, I decided to generate my own updated dataset.
In this article, I will explain how I merged all countries’ data from the Berkeley Earth website into a single dataset.
The process was not simple, but it was worth it👇🏻
#1. Understanding how the data is stored
The first step was understanding what data to collect and how it is stored in Berkeley Earth. If you go check the Berkeley Earth website, you can easily find that there is a dedicated section to data.
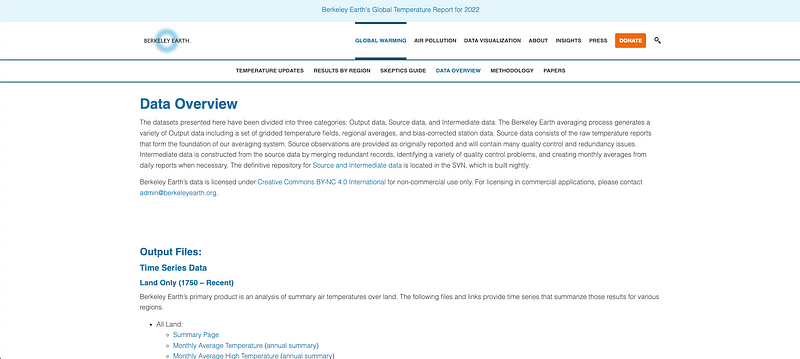
Berkeley Earth offers global temperature records or temperature datasets by countries or cities. As I wanted to create a dataset containing the historical climate records for all countries, I had to choose the second option.
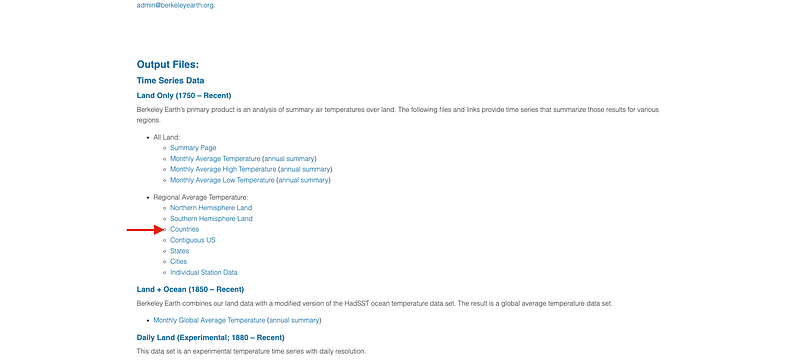
Clicking in the Countries section, we are led to a list of countries for which there are historical records of surface temperature.
If we try clicking on any of these countries, we go right away to a website containing different analytics for the selected country. However, I want the raw data — not some premade report.
If we check closely, we can find a link to a .txt file containing all the historical data for the selected country under the first historical average temperature graph, as you can observe in the following picture.
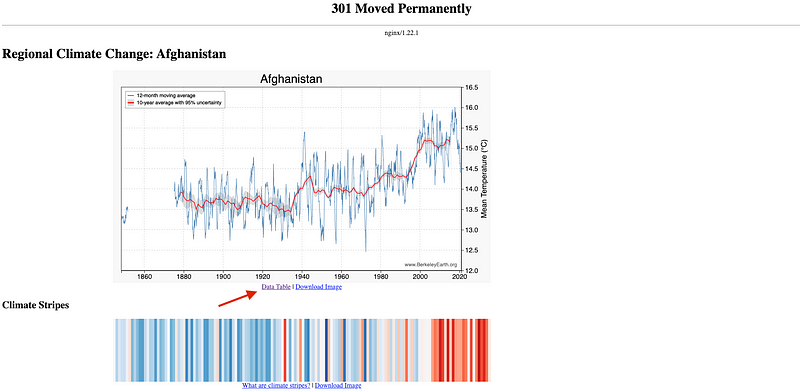
So, voilà! We already know where’s our data contained.
#2. Setting up our environment.
To develop such project, there are two main required libraries:
- BeautifulSoup is a Python library for pulling data out of HTML and XML files.
- Requests: Requests library allows easy HTTP requests in Python.

To set up our environment, we first need to:
- Install Beautiful Soup: Run the following command in your command prompt or terminal
pip install beautifulsoup - Install Requests: Run the following command in your command prompt or terminal
pip install requests
Once we have all the required libraries installed in our environment, we start our code by loading all of them. Apart from BeautifulSoup and Requests, we will need Pandas and Numpyas well.
#3. Detecting how many countries we need to parse
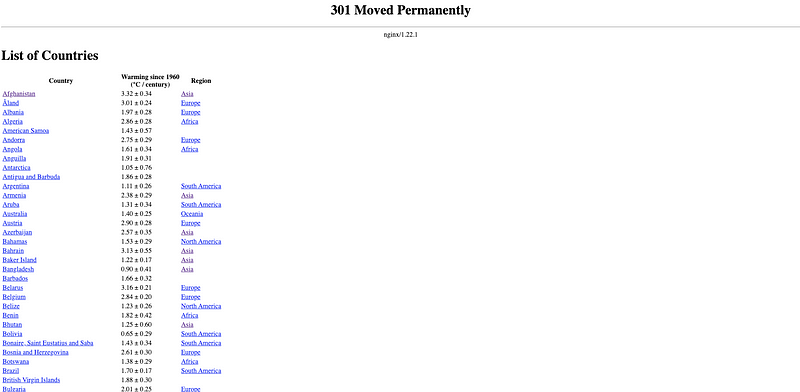
The following logical step will be determining what countries dataset are available to be parsed and stored. To do so, we go back to the countries list page.
As we can see, there is a table-like element containing all countries, their mean temperature and their region. If we inspect the element, we can clearly observe that every row is contained in a tr element.
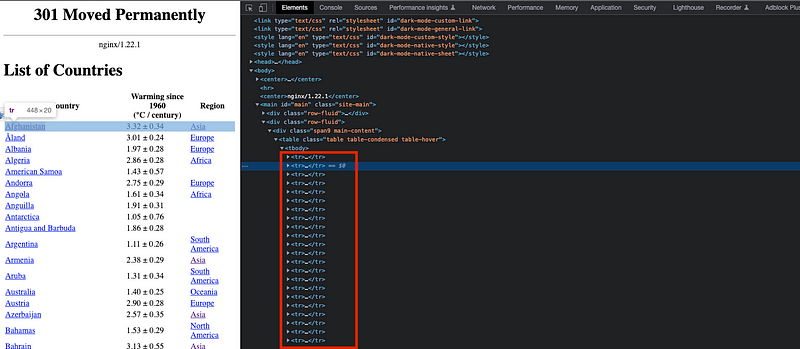
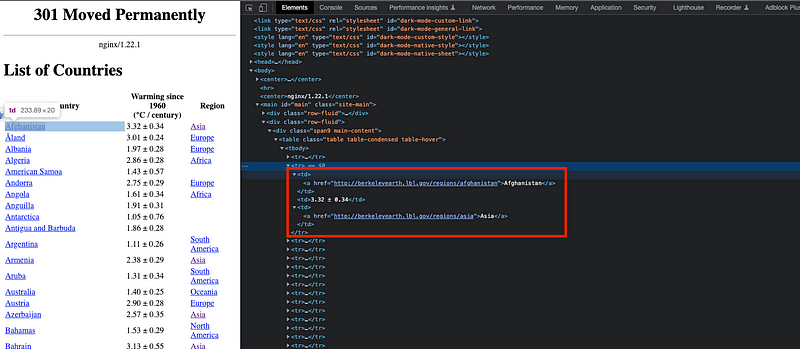
And each of the records for each row — country name, temperature and region — is contained in a td element.
A list containing all country names to be scraped can be easily generated by using the Beautifulsoup library:
- We first create an URL object and define the website URL that contains all available countries — https://berkeleyearth.lbl.gov/country-list/
- Then we parse the website using the page = requests.get(URL) command, which sends an HTTP GET request to the specified URL and stores the response in the variable page.
- The third step is to create three void variables to contain the names, temperatures, and regions elements.
- We find all tr elements on the website.
- For every tr element, we find all tr elements and if they do exist, we store the elements in the void lists.
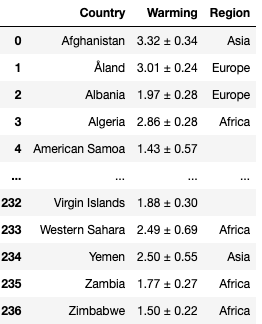
- We generate a pandas dataframe containing the exact same table in our local environment.
All the previous steps are found in the following piece of code.
And the following dataframe containing all available counries is obtained.
#4. Browse all countries and merge their data
Now we need to study how to loop all available data for different countries to merge them all into a single dataset.
I could click into each of the countries on the list and then click again into the .txt file link to parse the data — I should use Selenium and a chrome driver for this, as I did in the Linkedin scraping case — however, it doesn’t make much sense as I already know the list of countries I want to parse.
We need to find some pattern so I can call the .txt files for each country and loop them without having any middle step. This is why we can focus on inspecting the .txt file URL. If we observe the Afghanistan URL, we can see a structure:

The following structure is observed:
“http://berkeleyearth.lbl.gov/auto/Regional/TAVG/Text/” + country name + “TAVG-Trend.txt”
If you check any other country, you will see this logic holds for all countries. It is important to consider that for those countries with more than one word on their name — such as the United Kingdom, South Korea… — there is a splitting hyphen between them.
So I generate a first function called request_data that allows to parse the .txt file for a given country and store it into a list of strings.
#5. Understanding how country files are structured
Now that we already have all the .txt file data contained in the corresponding list for a given country, I want to parse — understand — the data file and store it in pandas dataframe.
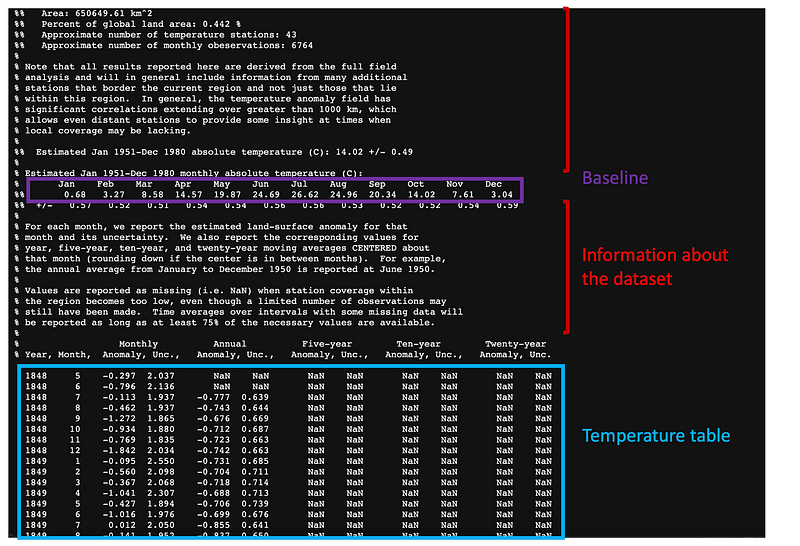
It is important to notice that the historic data does not contain the actual temperatures — but the variation when compared to the Estimated Jan 1951-Dec 1980 monthly absolute temperature. This means that from any .txt file I need to get two main key data:
- What I called the baseline, corresponds to the Estimated Jan 1951-Dec 1980 monthly absolute temperature and allows me to get back the actual temperatures. It is located in the 52nd or 53rd row of the file, depending on the country we are checking.
- The temperature table itself is always contained at the bottom of the file. Remember it contains the variation when compared to the baseline, and not the actual temperatures!!
The rest of the .txt file is not of our interest, so we will neglect it.
This is why I create two additional functions:
#5.1 Getting the baseline
This first function aims to get the 12 Estimated Jan 1951-Dec 1980 monthly absolute temperature values — one for each month.
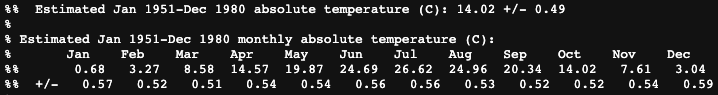
In this case, I defined a function that gets the baseline. The steps are quite straightforward:
- Get the row where the baseline is located.
- Split the string by spaces so we get all elements contained in the row.
- Remove the white spaces so only non-null elements remain.
- Earse the “+/-” element — as I don’t want it.
- Generate a list containing all 12 mean temperature values.
- This procedure is first tried for the 53rd row — as most countries have their baseline located in this row. If this fails, the same procedure will be repeated for the 52nd.
The code is attached as follows:
A list containing all temperatures is obtained as a result.

#5.2 Getting the historical data
Once the baseline is obtained, I want to get the historical data table. The data is parsed as follows:
- The table content is defined starting at row 71st.
- I generate 6 void lists to store the values of interest.
- I loop line by line splitting the string elements and removing all white spaces so only non-null values remain — similar to I did for the baseline.
- During every loop — corresponding each to a single row — all variables of interest are stored in their corresponding list.
- The temperature is computed using the baseline — so I store the actual value.
- The pandas dataframe is constructed
The code is attached as follows:
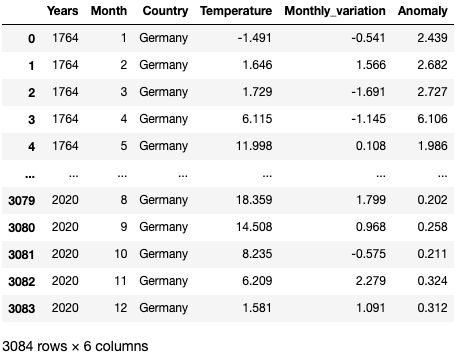
If the previous function is used with Germany, one can obtain the following output:
#6. Getting the historical data and merging it into a final table
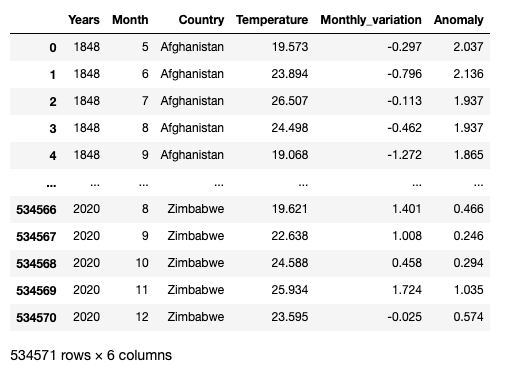
Now that I am able to get the historic temperature data for a given country, I can simply loop over all countries contained in the countries list and merge every dataset using a concat command so I end up with all the data contained in a single dataset.
The final dataset is obtained! :)
You can get the final dataset in here. Feel free to ask me any further question! :D
Data always has a better idea — trust it.
You can suscribe to my Medium Newsletter to stay tuned and receive my content. I promise it will be unique!
If you are not a full Medium member yet, just check it out here to support me and many other writers. It really helps :D
Some other nice medium related articles you should go check out! :D


