
Creating Free Cash Flow KPI in Power BI in 4 easy steps
In the modern business landscape, the ability to accurately track and analyze financial metrics is paramount for informed decision-making. Free Cash Flow (FCF) stands out as a critical indicator of a company’s financial health, providing insight into the actual cash a company generates after accounting for capital expenditures. Crafting a robust FCF KPI in Power BI allows businesses to dynamically visualize and interpret this crucial metric.
What is Free Cash Flow (FCF)?
- Definition: Free Cash Flow is the cash generated by a company after accounting for capital expenditures needed to maintain or expand its asset base.
- Importance: It reflects a company’s ability to generate surplus cash that can be used for expansion, dividends, debt reduction, or other discretionary expenditures.
Components:
- Operating Cash Flow (OCF): Cash generated from normal business operations.
- Capital Expenditures (CapEx): Funds used by a company to acquire, upgrade, and maintain physical assets such as property, industrial buildings, or equipment.
- Calculation: FCF = Operating Cash Flow — Capital Expenditures
Why Track FCF in Power BI?
- Dynamic Visualization: Power BI’s interactive dashboards allow for real-time tracking and analysis.
- Data Integration: Seamlessly integrate data from various sources, ensuring comprehensive insights.
- Predictive Analytics: Leverage Power BI’s advanced analytics capabilities to forecast future FCF trends and make strategic decisions.
Ready to dive into the step-by-step process? Let’s get your Free Cash Flow KPI up and running in Power BI!
This is how your end result KPI is going to look like:

Building the KPI
We will go through these steps:
Happy learning!
1. Understanding the Table used:
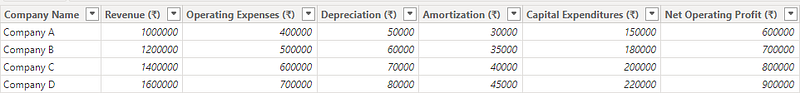
This table displays financial data for four companies: Company A, Company B, Company C, and Company D. Here’s a quick rundown:
- Revenue (₹): The total income generated by each company. Company D has the highest revenue at ₹16,00,000.
- Operating Expenses (₹): The costs incurred in running the business. These increase progressively from Company A to Company D.
- Depreciation (₹): The reduction in the value of assets over time. Company D has the highest depreciation at ₹80,000.
- Amortization (₹): The process of gradually writing off the initial cost of an asset. Again, Company D leads with ₹45,000.
- Capital Expenditures (₹): Funds used to acquire or upgrade physical assets. Company D is spending the most here as well at ₹2,20,000.
- Net Operating Profit (₹): Revenue minus operating expenses, showing the actual profit made from operations. Company D tops this with ₹9,00,000.
2. DAX for Operating Cash Flow:
Operating Cash Flow measure = SUM(‘Free Cash Flow’[Net Operating Profit (₹)]) + SUM(‘Free Cash Flow’[Depreciation (₹)]) + SUM(‘Free Cash Flow’[Amortization (₹)])

This DAX measure calculates the Operating Cash Flow for a table named ‘Free Cash Flow’ by summing up three specific columns:
- Net Operating Profit (₹): The profit a company makes from its operations.
- Depreciation (₹): The reduction in value of tangible assets over time.
- Amortization (₹): The gradual write-off of intangible assets over time.
The measure adds up the values from these three columns to give the total Operating Cash Flow. This is a crucial metric to see how much cash is generated from the business’s core operations, excluding any capital expenditures.
3. DAX for Free Cash Flow:
Free Cash Flow Company A = CALCULATE([Operating Cash Flow measure] — SUM(‘Free Cash Flow’[Capital Expenditures (₹)]), ‘Free Cash Flow’[Company Name] = “Company A”)

This DAX formula is designed to calculate the Free Cash Flow specifically for “Company A”. Here’s how it works:
- CALCULATE : This is used to modify the context of a calculation or measure.
- [Operating Cash Flow measure] — SUM(‘Free Cash Flow’[Capital Expenditures (₹)]): This part subtracts the total Capital Expenditures from the Operating Cash Flow measure, giving you the Free Cash Flow.
- ‘Free Cash Flow’[Company Name] = “Company A”: This condition ensures that the calculation is filtered to include only the data for “Company A”.
Essentially, this formula calculates how much cash Company A has after accounting for its capital expenditures.
4. Designing the KPI card:
- Add a Card(new) from Visualizations.
- Put Free Cash Flow Company A measure to it.
- In Format visual → General →Properties set the following:
Height — 125
Width — 274
- In Format visual → Visual →Callout values, set Horizontal alignment to Center in Values.
- Set Label font size to 14 and Bold the font for both Values and Label.
- In Format visual → Visual →Cards set Background Color to #E6E6E6.
- Turn off Border.
- In Format visual → General →Effects turn off Background.
- Go to the Insert tab and select Rectangle from Shapes.
- In the Format visual →General →Properties set the following:
Height — 118
Width — 272
- In the Format visual → Style set Color to #CCCCCC.
- Cut and Paste the KPI card and then adjust the KPI on top of the rectangle.
Finally we will have our KPI card
Download the Data for this KPI from this link.
Thank you for your attention!
Follow me or subscribe to get all my Power BI articles!
Don’t forget to subscribe to
👉 Power BI Publication
👉 Power BI Newsletter
and join our Power BI community:


