Creating dynamic texts based on hierarchies in Power BI
Space is precious in Power BI reports. But how do we know what we selected from each slicer when we build a Slicer pane and hide all the slicers? Here comes dynamic titles with hierarchies.

Introduction
I usually don’t want to “waste” space on my Power BI report with Slicers.
When I have many dimensions in my data model, the users request Slicers for all or most of them.
We have two solutions to solve this problem:
- A Slicer page
- A Slicer pane
I can create a Slicer page, place all Slicers there, and apply (synchronize) the slicers to all other pages.
Or I can create a Slicer pane.
You can watch this video to learn how to do it:
I recommend reading this piece by Nikola Ilic to improve the functionality of the Slicer pane:
Now the problem:
You no longer see your selections when you leave the Slicer Page or close the Slicer pane.
This is fine for you as a data model developer.
But when the users show the report, or a screenshot of it, to someone else, the audience should understand what they are looking at.
To solve this problem, I create measures that dynamically show the selected elements from each slicer while using less space than Drop-down Slicers.
Ideally, I show this information in the Title section of the report.
When I have only one attribute in a Slicer, there is no Problem.
But working with hierarchies is an entirely different beast.
Date Title
First, I need a title to show the selected period.
It depends on what is selected:
- An entire year
- A semester or a quarter
- One or more months
- The dates
To simplify things, I assume that my users only want to look at yearly, quarterly, or monthly results.
The solutions shown here could also be expanded to cover the other possibilities.
OK, back to the main topic.
There is an issue with the date hierarchy in DAX from the beginning.
The issue is that I have multiple ways to construct the date hierarchy, and I don’t know which attributes will be used in the reports when building the data model. However, I don’t want to build my code and restrict the reporting possibilities.
As an example, look at the multiple ways I can look at the month:
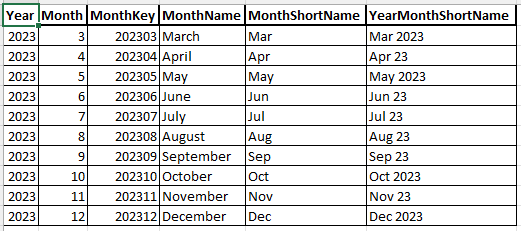
As you can see, we have five different columns for the month. Four will be used in the report, but I also saw Power BI reports using the MonthKey column.
Consequently, I must build my code for the dynamic title to work with any of these columns.
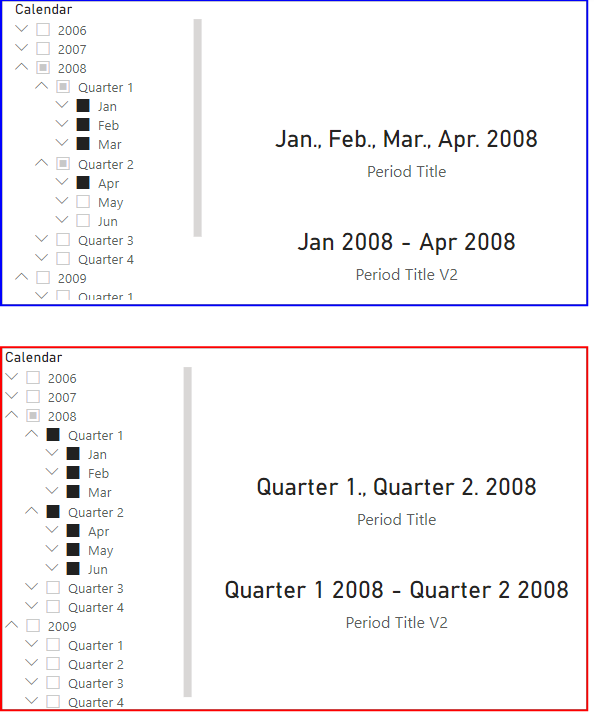
I aim to create a Text-Measure that checks if only one month is selected. If yes, show the selected month. If not, show the list of selected months.
Period Title =
VAR Year = SELECTEDVALUE('Date'[Year])

// Check if at least one month is selected
VAR Month = IF(ISCROSSFILTERED('Date'[MonthKey])

// Combine all selected months
,CONCATENATEX(VALUES('Date'[MonthShortName])
                      ,'Date'[MonthShortName]
                      ,"., ")
                      )

RETURN
// Check if something is selected
IF(ISBLANK(Year)
  // If not, return the replacement text
  ,"Please select a period"
  // If yes, return the list of months
  ,IF(Month <> "", Month & ". " & Year, Year)
  )
The first Variable
I use the SELECTEDVALUE() function to check for this.
The second variable,
To cover the issue described above, I use the ISCROSSFILTERED() function to check if any other column in the Date table filters the MonthKey column.
If yes, I use the CONCATENATEX() function to assemble a string with all selected months.
In the end, I check if no Year is selected ( ISBLANK(‘Date’[Year]) )
If yes, I return a text to ask the user to choose a period.
If no, I check if the
I can add a text like “Selected Periods: “or something like that to the output if necessary.
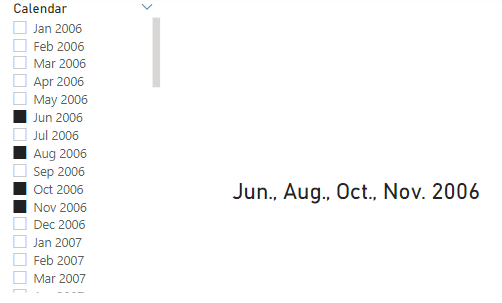
The beauty of this solution is that it works regardless of which column I use in the calendar Slicer.
Anyway, I experienced a case when the months were not sorted correctly, which was very ugly. Until today, I didn’t find the cause for this issue.
But this solution has one issue: When I select months spanning over more than one year, it stops working:
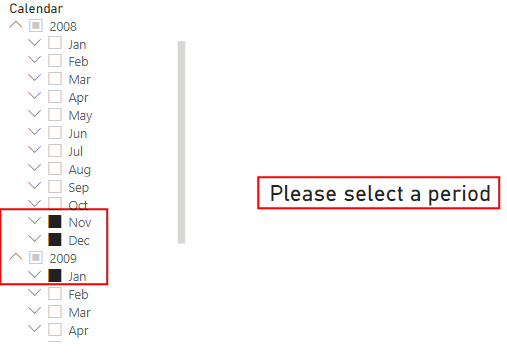
To solve this issue, I use a solution that gets the first and the last Month and Displays a Text like “Nov. 2008 — Jan. 2009”:
Period Title V2 =
// Get the first selected Month
VAR FirstMonth = SELECTEDVALUE('Date'[MonthKey])

// Get the last selected Month
VAR LastMonth = IF( ISCROSSFILTERED('Date'[MonthKey])
                  ,MAX('Date'[MonthKey])
                  )

// Get the Names of the first and the last selected Month
VAR FirstMonthName = LOOKUPVALUE('Date'[YearMonthShortName]
                                ,'Date'[MonthKey]
                                ,FirstMonth)

VAR LastMonthName = LOOKUPVALUE('Date'[YearMonthShortName]
                                ,'Date'[MonthKey]
                                ,LastMonth)

RETURN
// Check if anything has been selected
IF(ISBLANK(FirstMonth)
  // If not, write the replacement text
  ,"Please select one or more periods"
  // If yes, return the chosen periods
  // If only one month is selected, return only that Month
  // Else return the From-To Months
  ,IF(FirstMonthName <> LastMonthName, FirstMonthName & " - " & LastMonthName, FirstMonthName)
  )
As you can see, I use the same principle to get the first and the last
But then, I use the LOOKUPVALUE() function to get the YearMonthShortName column for both Months.
Based on the same selection as before, the result looks like this:
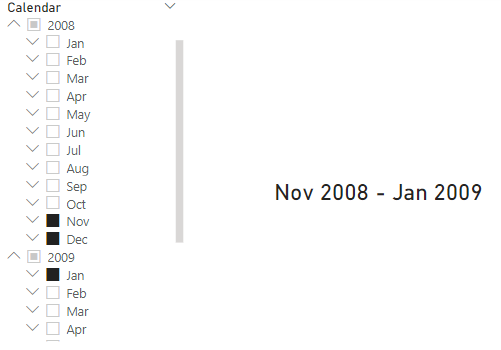
Of course, if the selection has gaps, the Measure doesn’t return the correct text. For example, for a selection like Sep. 2008, Dec. 2008 and Jan. 2009, the Mease will return Sep. 2008 — Jan. 2009.
As you can see, both solutions work, but they have different issues.
Our task, as developers, is to show them to the stakeholders and help them decide which is best for their specific use cases.
Adding quarters to the Measure
Now, let’s explore how to change the Measure to detect if a quarter is selected.
For the actual solution, the selection of a quarter is only the selection of all months assigned to the selected quarter.
But I want to show the quarter instead of three months.
For this, I use the approach shown in my previous article about hierarchies:
The approach is to collect information on what is selected where in the hierarchy and use a SWITCH() with the conditions in the correct order to find out what the output should be.
Here is the corresponding first Version:
Period Title =
VAR SelYear = SELECTEDVALUE('Date'[Year])

// Check if at least one quarter is selected
VAR Quarters = IF(ISCROSSFILTERED('Date'[QuarterKey])

// Combine all selected quarters
,CONCATENATEX(VALUES('Date'[QuarterName])
                      ,'Date'[QuarterName]
                      ,"., ")
                      )

// Get the list Date from the Selection
VAR FirstSelectedDate = MIN('Date'[Date])

// Get the last Date from the Selection
VAR LastSelectedDate = MAX('Date'[Date])

// Check if the first selected date is the Start of a Quarter
VAR IsAtQuarterStart =IF(DATE(SelYear, MONTH(FirstSelectedDate), 1)
                                            IN {DATE(SelYear, 1, 1)
                                                ,DATE(SelYear, 4, 1)
                                                ,DATE(SelYear, 7, 1)
                                                ,DATE(SelYear, 10, 1) }
                        ,TRUE()
                        ,FALSE()
                        )

// Calculate the number of selected months
// Add 1, as when one Month is selected, the result is 0
VAR MonthsSelected = DATEDIFF(FirstSelectedDate, LastSelectedDate, MONTH) + 1

// Check if only one quarter is selected
VAR OneQuarterSelected = HASONEVALUE('Date'[QuarterKey])

// Check if at least one month is selected
VAR Month = IF(ISCROSSFILTERED('Date'[MonthKey])
                  // Combine all selected months
                  ,CONCATENATEX(VALUES('Date'[MonthShortName])
                                  ,'Date'[MonthShortName]
                                  ,"., ")
                                  )

RETURN
// Check if something is selected
IF(ISBLANK(SelYear)
    // If not, return the replacement text
    ,"Please select a period"
    // If yes, return the list of months
    ,SWITCH(TRUE()
        // The entire year is selected
        ,MonthsSelected = 12, CONVERT(SelYear, STRING)
        // If one or more full quarters are selected
        ,MOD(MonthsSelected, 3) = 0 && IsAtQuarterStart = TRUE() && Quarters <> "", Quarters & ". " & SelYear
        // If multiple months are selected, crossing more than one quarter
        ,OneQuarterSelected = FALSE() && Month <> "", Month & ". " & SelYear
        // Less than one quarter is selected
        ,MonthsSelected < 3 && Month <> "", Month & ". " & SelYear
        )
    )
This solution’s key is the checks’ order in the SWITCH() function.
All other details are needed to cover all variants of any selection.
The only selection that doesn’t work is when the first and the last month of the same quarter are selected. In this case, the quarter is returned. But such a selection makes little sense to me.
As mentioned above, the first version cannot handle selections that cross multiple years.
For such a scenario, we need to expand the second version accordingly:
Period Title V2 =
VAR FirstSelYear = SELECTEDVALUE('Date'[Year])

// Get the first selected Month
VAR FirstQuarter = IF( ISCROSSFILTERED('Date'[QuarterKey])
                      ,MIN('Date'[QuarterKey])
                      )

// Get the last selected Month
VAR LastQuarter = IF( ISCROSSFILTERED('Date'[QuarterKey])
                      ,MAX('Date'[QuarterKey])
                      )

// Get the Names of the first and the last selected Month
VAR FirstQuarterName = LOOKUPVALUE('Date'[YearQuarterName]
                                  ,'Date'[QuarterKey]
                                  ,FirstQuarter)

VAR LastQuarterName = LOOKUPVALUE('Date'[YearQuarterName]
                                  ,'Date'[QuarterKey]
                                  ,LastQuarter)

// Get the first selected Month
VAR FirstMonth = IF( ISCROSSFILTERED('Date'[MonthKey])
                      ,MIN('Date'[MonthKey])
                      )

// Get the last selected Month
VAR LastMonth = IF( ISCROSSFILTERED('Date'[MonthKey])
                      ,MAX('Date'[MonthKey])
                      )

// Get the Names of the first and the last selected Month
VAR FirstMonthName = LOOKUPVALUE('Date'[YearMonthShortName]
                                ,'Date'[MonthKey]
                               ,FirstMonth)

VAR LastMonthName = LOOKUPVALUE('Date'[YearMonthShortName]
                                ,'Date'[MonthKey]
                                ,LastMonth)

// Get the list Date from the Selection
VAR FirstSelectedDate = MIN('Date'[Date])

// Get the last Date from the Selection
VAR LastSelectedDate = MAX('Date'[Date])

// Check if the first selected date is the Start of a Quarter
VAR IsAtQuarterStart =IF(DATE(FirstSelYear, MONTH(FirstSelectedDate), 1)
                                    IN {DATE(FirstSelYear, 1, 1)
                                        ,DATE(FirstSelYear, 4, 1)
                                        ,DATE(FirstSelYear, 7, 1)
                                        ,DATE(FirstSelYear, 10, 1) }
                              ,TRUE()
                              ,FALSE()
                              )

// Calculate the number of selected months
// Add 1, as when one Month is selected, the result is 0
VAR MonthsSelected = DATEDIFF(FirstSelectedDate, LastSelectedDate, MONTH) + 1

// Check if only one quarter is selected
VAR OneQuarterSelected = HASONEVALUE('Date'[QuarterKey])

RETURN
// Check if anything has been selected
IF(ISBLANK(FirstMonth)
    // If not, write the replacement text
    ,"Please select one or more periods"
    // If yes, return the selected periods
    // If only one month is selected, return only that Quarter or Month
    // Else return the From-To Quarter / Months
    // If yes, return the list of months
      ,SWITCH(TRUE()
          // The entire year is selected
          ,MonthsSelected = 12, CONVERT(FirstSelYear, STRING)
          // If one or more full quarters are selected
          ,MOD(MonthsSelected, 3) = 0 && IsAtQuarterStart = TRUE() && FirstQuarterName <> "", IF(FirstQuarterName <> LastQuarterName, FirstQuarterName & " - " & LastQuarterName, FirstQuarterName)
          // If multiple months are selected, crossing more than one quarter
          ,OneQuarterSelected = FALSE() && FirstMonthName <> "", IF(FirstMonthName <> LastMonthName, FirstMonthName & " - " & LastMonthName, FirstMonthName)
          // Less than one quarter is selected
          ,MonthsSelected < 3 && FirstMonthName <> "", IF(FirstMonthName <> LastMonthName, FirstMonthName & " - " & LastMonthName, FirstMonthName)
          )
    )
Same as above, this Measure cannot work with gaps in the selection of Months or Quarters.
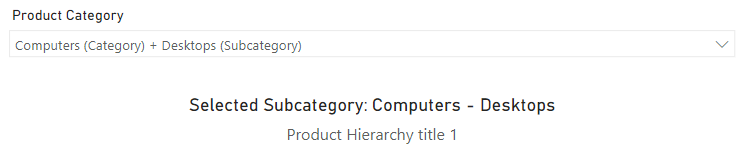
Here are the results of two different selections:
The problem with hierarchies
Let’s return to the beginning: We want to save space on our reports.
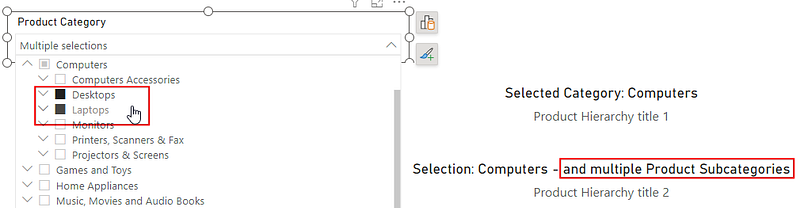
When we use Dropdown Slicers with hierarchies and select an item from the last level, for example, in a hierarchy with Product Category, Subcategory, and Products, we will see something like this:

For the user, it is pointless that the Dropdown slicer shows the column name. It takes away much space, and I must enlarge the Slicer to be extremely wide to ensure the user can see the selected item from the entire hierarchy.
I filed an entry on the Fabric Ideas page for this issue (Feel free to vote for it to increase the visibility of this idea):
https://ideas.fabric.microsoft.com/ideas/idea/?ideaid=584b953b-1b17-ee11-a81c-00224853a463
So, let’s look at how to build dynamic titles for hierarchies.
Hierarchy titles
With hierarchies, I want a dynamic title in the top section, a.k.a. the Title section, of my report displaying the selections in my Slicers.
Like above, with the Calendar hierarchy, I want to display the selection depending on the selection.
For example:
- The User selects the “Computers” Product Category, and I want to display: “Selected Category: Computers”
- The User selects the Subcategory “Desktops” inside the “Computers” Category, and I want to display: “Selected Subcategory: Computers — Desktops”
- The User selects a single Product, like “Desktop ABC” I want to display: “Selected Product: Computers — Desktops — Desktop ABC”
I will cover how to cope with multiple selections later.
For the moment, I use the SELECTEDVALUE() function to solve these requirements:
Product Hierarchy title 1 =
VAR Category = SELECTEDVALUE('Product'[Category])

VAR SubCategory = SELECTEDVALUE('Product'[Subcategory])

VAR ProductName = SELECTEDVALUE('Product'[Product Name])

RETURN
SWITCH(TRUE()
  ,ISBLANK(Category), "Please select a Category"
  ,NOT ISBLANK(ProductName), "Selected Product: " & Category & " - " & SubCategory & " - " & ProductName
  ,NOT ISBLANK(SubCategory), "Selected Subcategory: " & Category & " - " & SubCategory
  ,"Selected Category: " & Category
  )
Again, the key to this approach is the order of the conditions in the SWITCH() function.
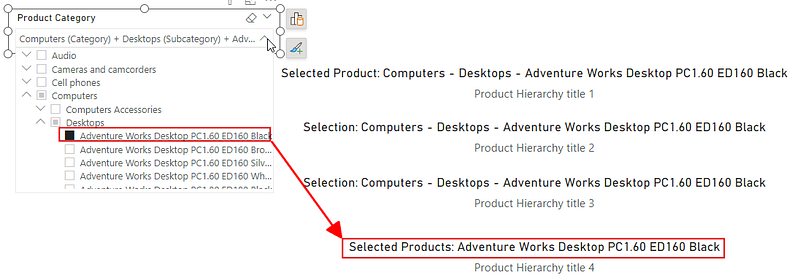
The result is the following:
Now, what happens when I select multiple Subcategories?
I do not get anything as SELECTEDVALUE() returns only a value when precisely one value is present in the current Filter Context. I see only the text for the Category.
What I can do is to add a Text like “and multiple Subcategories”:
Product Hierarchy title 2 =
VAR Category = SELECTEDVALUE('Product'[Category])

VAR SubCategory = SELECTEDVALUE('Product'[Subcategory])

VAR ProductName = SELECTEDVALUE('Product'[Product Name])

RETURN
SWITCH(TRUE()
  ,ISBLANK(Category), "Please select a Category"
  ,NOT ISBLANK(ProductName), "Selection: " & Category & " - " & SubCategory & " - " & ProductName
  ,NOT ISBLANK(SubCategory), "Selection: " & Category & " - " & SubCategory & " - " & "and multiple products"
  , "Selection: " & Category & " - " & "and multiple Product Subcategories"
  )
With this solution, I will get this:
It works perfectly. But I don’t know if I selected multiple Subcategories or if I selected the “Computers” Category, which contains multiple Subcategories.
The result is the same.
But by combining the solution shown above, using CONCATENATEX(), with our solution, I can get something interesting: The list of explicitly selected Items.
Product Hierarchy title 3 =
VAR Category = SELECTEDVALUE('Product'[Category])

VAR SubCategory = SELECTEDVALUE('Product'[Subcategory])

VAR AllSubcategories = IF(ISBLANK(SubCategory)
              ,CONCATENATEX(VALUES('Product'[Subcategory])
                    ,'Product'[Subcategory]
                    ,"., ")
              ,SubCategory
              )

VAR AllCategories = IF(ISBLANK(Category)
              ,CONCATENATEX(VALUES('Product'[Category])
                  ,'Product'[Category]
                  ,"., ")
              ,Category
              )

VAR ProductName = SELECTEDVALUE('Product'[Product Name])

RETURN
SWITCH(TRUE()
  ,NOT ISFILTERED('Product'[Category]), "Please select a Category"
  ,NOT ISBLANK(ProductName), "Selection: " & Category & " - " & AllSubcategories & " - " & ProductName
  ,NOT ISBLANK(SubCategory), "Selection: " & Category & " - " & AllSubcategories & " - " & "and multiple products"
  ,ISFILTERED('Product'[Subcategory]) && ISBLANK(SubCategory), "Selection: " & Category & " - " & AllSubcategories
  ,AllCategories
  )
Now, the result is the following:
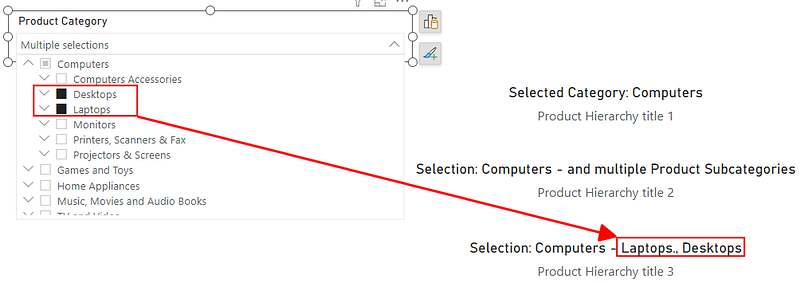
This solution will not display the list of all products assigned to a Subcategory, which can be very long. But, as above, it will display the Product Name if only one Product is selected.
Next, I can change the Measure to show only the lowest selection.
To accomplish this, I must go back to the techniques shown in my previous article (Linked above) and use one of the techniques described there:
Product Hierarchy title 4 =
VAR Category = SELECTEDVALUE('Product'[Category])

VAR SubCategory = SELECTEDVALUE('Product'[Subcategory])

VAR ProductName = SELECTEDVALUE('Product'[Product Name])

VAR AllSubcategories = IF(ISBLANK(SubCategory)
              ,CONCATENATEX(VALUES('Product'[Subcategory])
                  ,'Product'[Subcategory]
                  ,"., ")
              ,SubCategory
              )

VAR AllCategories = IF(ISBLANK(Category)
              ,CONCATENATEX(VALUES('Product'[Category])
                  ,'Product'[Category]
                  ,"., ")
              ,Category
              )

VAR AllProducts = IF(ISBLANK(ProductName)
              ,CONCATENATEX(VALUES('Product'[Product Name])
                  ,'Product'[Product Name]
                  ,"., ")
              ,ProductName
              )

RETURN
SWITCH(TRUE()
  ,HASONEVALUE('Product'[Product Name]), "Selected Products: " & AllProducts
  ,HASONEVALUE('Product'[Subcategory]), "Selected Subcategories: " & AllSubcategories
  ,HASONEVALUE('Product'[Category]), "Selected Categories: " & AllCategories
  ,"Please select a Category"
  )
When one Product is selected, the result is the following (Compared with the other three variants):
Unfortunately, this works only when the user selects only one Product. When multiple products are selected, the Measure returns the Subcategory.
Again, we must discuss these variants with the Stakeholders to decide which suits their needs best.
This is the last variant I wanted to show you.
But there is one final point to mention.
Using Shapes instead of Card Visuals
Usually, I use the Card Visual to display text Measures.
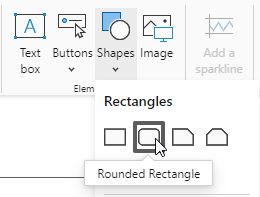
During my last client project, I learned about an alternative to this: Using a rectangular shape and adding the Measure as Text:
- Add a rectangular shape with rounded edges:
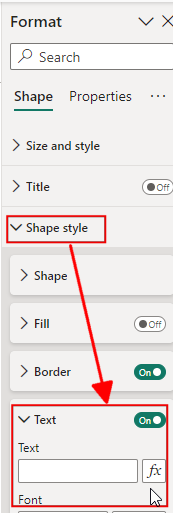
2. Remove the Background from the Formatting pane.
3. Set the border as you wish.
4. Now enable the Text Option below the “Shape Style” Section and click on the fx Button:
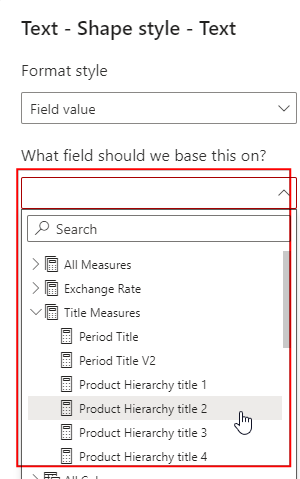
5. In the new dialog, you can select the Measure you want to display as text in the Shape and click on OK:
6. Result: The Text is displayed in the Shape
Why should we do this?
The reason is that we have more options for text formatting than with a Card Visual.
For example, we can center the text horizontally and vertically, which is impossible with the Standard Card Visual. And we have some more usable effects for the text.
I’m not a fan of setting fancy effects in a report. But it can be helpful to highlight certain aspects of the report.
Conclusion
This piece gives you all the tools to build your dynamic text Measures.
I found navigating hierarchies based on the selection and the current Filter Context helpful.
As mentioned in my previous article (linked above), I plan to write another piece about working with unbalanced hierarchies.
I will be happy to have you there as well.
References
My last article about calculating the percentage depending on the position in a hierarchy:
It contains valuable information on navigating and detecting the position within a hierarchy.
The piece above was the first part of a three-part series on how to handle hierarchies in DAX.
This is the second part and the third part is the following:
On creating a Filter Pane by Guys in a Cube:
I recommend reading this piece by Nikola Ilic to improve the functionality of the Slicer pane:
I use the Contoso sample dataset, like in my previous articles. You can download the ContosoRetailDW Dataset for free from Microsoft here.
The Contoso Data can be freely used under the MIT License, as described here.
Don’t forget to subscribe to
👉 Power BI Publication
👉 Power BI Newsletter
and join our Power BI community
👉 Power BI Masterclass


