
Building a Simple Financial Stock Screener using Refinitiv LSEG Python API

Refinitiv, established in 2018 as a Thomson Reuters subsidiary, is a global provider of financial market data and infrastructure. After its acquisition by the London Stock Exchange Group (LSEG) in October 2019, Refinitiv now serves users in about 190 markets, marking it as a leading data service provider in the financial industry. Proficiency in using Refinitiv has become crucial for the financial industry, and this article explores its capabilities through Python.
The Refinitiv Data Library (RD Lib) for Python provides a user-friendly API that accesses a vast array of financial data. On my previous article I discussed how to access the refinitiv data library API from the comfort of google colab by setting up your refinitiv-data.config.json file.
In this article, we will explore first how to download data from the most famous stock indexes and then how to create a simple stock screener using Refinitiv’s LSEG .get_data() method. We will use Google Colab as our IDE; if you haven't read my previous article, I strongly encourage you to do so.
Article Index:
- Create a Refinitiv LSEG session
- Getting the RIC of different indexes and their components
- Retrieve the data for the entire index
- Generating the ranking and the final score for the screener
- Wrapping the method inside a function and give some style to the output
- Conclusions
- References
Disclaimer: The information provided here is for informational purposes only and is not intended to be personal financial, investment, or other advice.
Create a Refinitiv LSEG session
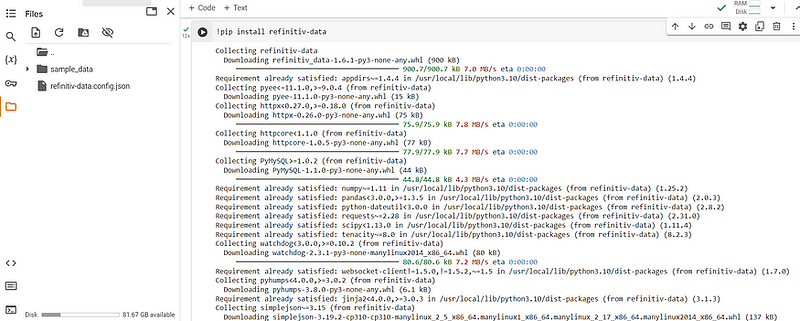
After successfully uploading/creating your refinitiv-data.config.json file then the next step is to install the refinitiv-data python library, we easily do this in google colab by typing !pip install refinitiv-data in a code cell.
Once the library is installed, then proceed to import the library by using the code below. Additionally we will import Numpy, Pandas, Scipy (to be used as part of the screener) as well as matploblib for visualizations.
import refinitiv.data as rd
from refinitiv.data.content import pricing
from refinitiv.data.content import symbol_conversion
import pandas as pd
import numpy as np
import matplotlib.pyplot as plt
from scipy import stats
Once all the libraries have been correctly imported, we can proceed to create a refinitiv session. The session object allows the user to stablish a connection with the different refinitiv data services and start interacting with their different products. To stablish a connection, it is as simple as typing the code below:
rd.open_session(name='platform.rdp',
                config_name="./refinitiv-data.config.json")
In our specific case, we just need to specify two things: first the connection type by typing platform.rdp in the name argument and secondly, the location of the configuration JSON file, by providing the location in the config_name argument.
Getting the RIC of different indexes and their components
In contrast with other financial API’s, that typically use the Ticker or symbol of a financial instrument Refinitiv uses an specific nomenclature called a RIC number. The Refinitiv Instrument Code (previously Reuters Instrument Code), or RIC, is a ticker-like code used by Refinitiv to identify financial instrments and indices.
To find the components of an index, one needs to first know the RIC number of the index itself. Below you will find an image of some of the most relevant indexes available in Refinitiv.
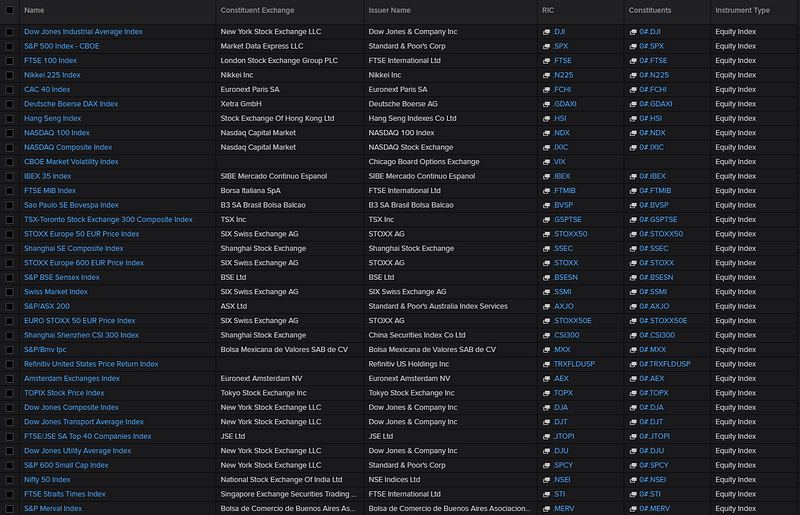
I personally track closely the following ones:
With the RIC components code and using the .pricing method inside Refintiv it is possible to get a list of the RIC of the different components inside an index. We just need to open . These can be acomplished using the code below:
sp500 = pricing.chain.Definition(name="0#.SPX").get_stream()
sp500.open()
sp500_RICS = sp500.constituents
sp500.close()
Now all of the RIC codes of the components of the S&P 500 are stored inside the variable sp500_RICS .
Retrieve the data for the entire index
Now that we have all the RIC’s of the S&P500, we can proceed to download the relevant data. For this specific screener we will retrieve the following information:
- PE ratio (PE)
- Enterprise Value / EBITDA (EV/EBITDA)
- Revenue Growth %
- Earnings Growth %
- Operating Margins
- Return on Equity (ROE)
Now the indicators for revenue grow, operating margins and earnings growth are not going to be retrieved directly but are going to be calculated based on the following data:
- Revenue current quarter
- Estimated revenue next quarter
- Operating Profit
- Total Revenue
- Earnings Per Share (EPS) from current quarter
- Estimated EPS next quarter
The indicators above, were selected based on the firm valuation YouTube lectures of Professor Aswath Damodaran from NYU. These lecture are a treasure 💰 and I strongly encourage anybody interested in firm valuation to watch them. His book on valuation is also great.
We can download the data, using our open session and the .get_data() method from Refinitiv. This method requires as arguments the fields (the features that we wish to download) and the universe (the financial instruments for which we want to download the fields). We can easily get the data by using the following code below:
fields = ['TR.TickerSymbol',
          'TR.CommonName',
          'TR.PriceClose',
          'TR.PE',
          'TR.EVToEBITDA',
          'TR.OperatingProfit(Period=FY0)',
          'TR.TotalRevenue(Period=FY0)',
          'TR.EPSMeanEstimate(Period=FQ1)',
          'TR.EPSActValue(Period=FQ-3)',
          'TR.RevenueMeanEstimate(Period=FQ1)',
          'TR.RevenueActValue(Period=FQ-3)',
          'TR.ReturnonAvgTotEqtyPctNetIncomeBeforeExtraItemsTTM']

sp500_df = rd.get_data(fields = fields,
            universe=universe)
With all the basic data we can proceed to calculate the operating margin, the revenue growth as well as the earnings growth. We will also simplify the name of the columns since by default they tend to be a little bit lengthy.
  sp500_df['Operating Margin'] = sp500_df['Operating Profit']/sp500_df['Total Revenue']
  sp500_df['RevenueGrowth'] = sp500_df[['Revenue - Mean Estimate','Revenue - Actual']].pct_change(axis='columns',periods = -1).iloc[:,0]
  sp500_df['EarningsGrowth'] = sp500_df[['Earnings Per Share - Mean Estimate','Earnings Per Share - Actual']].pct_change(axis='columns',periods = -1).iloc[:,0]
  sp500_df = sp500_df.drop(columns = ['Operating Profit','Total Revenue','Earnings Per Share - Mean Estimate', 'Earnings Per Share - Actual','Revenue - Mean Estimate','Revenue - Actual' ])

  sp500_df.columns = ['RIC','Ticker','Name','Price','PE','EV_EBITDA','ROE','OPS_Margin','Rev_Growth','Earnings_Growth']
Now the data is downloaded, but we still need to handle missing values, because most likely there is going to be. We will use the .fillna( ) method from pandas to handle this.
sp500_df['PE']= sp500_df['PE'].fillna(1000)
sp500_df['EV_EBITDA']= sp500_df['EV_EBITDA'].fillna(1000)
sp500_df['ROE']= sp500_df['ROE'].fillna(0)
sp500_df['OPS_Margin']= sp500_df['OPS_Margin'].fillna(0)
sp500_df['Rev_Growth']= sp500_df['Rev_Growth'].fillna(0)
sp500_df['Earnings_Growth']= sp500_df['Earnings_Growth'].fillna(0)

def correct_pe(x):
  if x< 0:
    return 1000
  else:
    return x

sp500_df['PE'] = sp500_df['PE'].apply(correct_pe)
For the PE and the EV/EBITDA we will fill the missing values with 1000 (a massive number that is impossible or almost impossible to see in real data), in case there is a PE with negative values, we will replace the negative values with 1000 as well. For the rest of the indicators we will fill them with 0. This strategy to handle missing values will become clear on the next section, we we will generate a ranking for each one of these indicators to create a final score for each one of the stocks of the index.
Generating the ranking and the final score for the screener
Now that the data is cleaned and the missing values were treated we can proceed to generate a composite score of the different indicators and rank the stocks appropiately. This step will highlight the stocks inside the index that are potential bargains.
To generate the ranking we will use the percentilescore method inside the stats module of Scipy stats.percentileofscore this method assigns an score from 0 to 100 to values given a range for which they can vary. For example if I have three PE ratios [1,2,3] and I want to determine the score of a PE equal to 2 we can call the percentilescore function using the code below and we will obtain an score of 66.66%.
stats.percentileofscore([1, 2, 3], 2, kind='weak')

>>>>

66.66666666666667
With this function we can generate an score column for each one of the indicators that we compiled and once we have all of the individual score we can aggregate them using a function like the average or the median. For this article we will simply use the mean. Please note that there is also the possibility to modify the code below to calculate a weighted average instead.
num_columns = ['PE','EV_EBITDA','Rev_Growth','Earnings_Growth','OPS_Margin', 'ROE']

score_columns = []
for col in num_columns:
  sp500_df[col] = sp500_df[col].fillna(sp500_df[col].median())
  new_col_name = f'pct_sc_{col}'
  percs = stats.percentileofscore(sp500_df[col],sp500_df[col],kind='weak')
  if col in ['PE','EV_EBITDA']:
    percs = 100 - percs + 100/len(data)
  sp500_df[new_col_name] = np.round(percs,1)
  score_columns.append(new_col_name)
sp500_df['SCORE'] = sp500_df[score_columns].mean(axis=1)
sp500_df = sp500_df.sort_values(by = 'SCORE',ascending=False)

sp500_df = sp500_df.drop(columns = score_columns).reset_index(drop=True)
sp500_df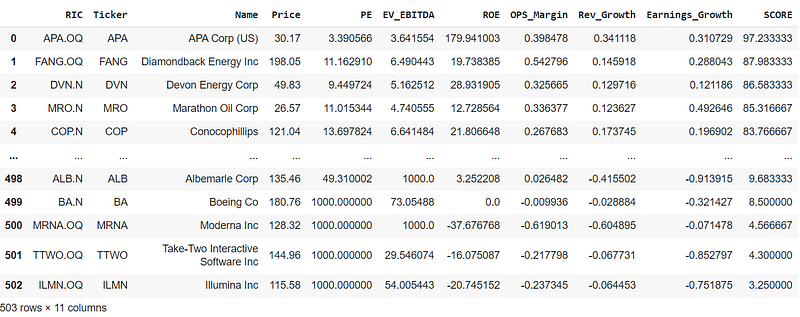
We have successfully downloaded and scored all the stocks that comprise the S&P 500. Now, let’s pause and assess if the scores we obtained make sense. A stock with a low P/E ratio or EV/EBITDA can be considered cheap. But if this stock also has a decent operating margin, is growing in revenue and earnings, and has a good return on equity, it is not only cheap but it can be considered a potential bargain and should score high on our screener. However, note that a company might appear cheap due to factors not captured by our screener, such as a struggling sector or industry, or a significant public relationship crisis. There are many reasons why a stock might seem undervalued and they can be very much rational, but sometimes it is just unfairly punished by the market (remember that sometimes the markets are governed by animal spirits). The screener simply highlights potential opportunities, our job is to detect them and continue with our due diligence.
Wrapping the method inside a function and give some style to the output
The code above is nice, but if we want to reuse the screener with a different index, or collection of stocks it is better that we create a function that generates the screener DataFrame.
def show_potential_cheap(rd,universe,drop_na = False,verbose = True):

  fields = ['TR.TickerSymbol',
          'TR.CommonName',
          'TR.PriceClose',
          'TR.PE',
          'TR.EVToEBITDA',
          'TR.OperatingProfit(Period=FY0)',
          'TR.TotalRevenue(Period=FY0)',
          'TR.EPSMeanEstimate(Period=FQ1)',
          'TR.EPSActValue(Period=FQ-3)',
          'TR.RevenueMeanEstimate(Period=FQ1)',
          'TR.RevenueActValue(Period=FQ-3)',
          'TR.ReturnonAvgTotEqtyPctNetIncomeBeforeExtraItemsTTM']

  if verbose:
    print(f'* Downloading data for {len(universe)} instruments')

  data = rd.get_data(fields = fields,
            universe=universe)

  if verbose:
    print(f'* Calculating initial columns')

  data['Operating Margin'] = data['Operating Profit']/data['Total Revenue']
  data['RevenueGrowth'] = data[['Revenue - Mean Estimate','Revenue - Actual']].pct_change(axis='columns',periods = -1).iloc[:,0]
  data['EarningsGrowth'] = data[['Earnings Per Share - Mean Estimate','Earnings Per Share - Actual']].pct_change(axis='columns',periods = -1).iloc[:,0]
  data = data.drop(columns = ['Operating Profit','Total Revenue','Earnings Per Share - Mean Estimate', 'Earnings Per Share - Actual','Revenue - Mean Estimate','Revenue - Actual' ])

  data.columns = ['RIC','Ticker','Name','Price','PE','EV_EBITDA','ROE','OPS_Margin','Rev_Growth','Earnings_Growth']


  if drop_na:
    data = data.dropna()
    if verbose:
      print(f'* Droping rows with missing values')
  else:
    data['PE']= data['PE'].fillna(1000)
    data['EV_EBITDA']= data['EV_EBITDA'].fillna(1000)
    data['ROE']= data['ROE'].fillna(0)
    data['OPS_Margin']= data['OPS_Margin'].fillna(0)
    data['Rev_Growth']= data['Rev_Growth'].fillna(0)
    data['Earnings_Growth']= data['Earnings_Growth'].fillna(0)

    if verbose:
      print(f'* Correcting for mising values')

  def correct_pe(x):
    if x< 0:
      return 1000
    else:
      return x

  data['PE'] = data['PE'].apply(correct_pe)
  num_columns = ['PE','EV_EBITDA','Rev_Growth','Earnings_Growth','OPS_Margin', 'ROE']

  if verbose:
    print(f'* Calculating Scores')

  score_columns = [] # store the name of the new score columns
  for col in num_columns:
    data[col] = data[col].fillna(data[col].median()) # fill missing values with the median value
    new_col_name = f'pct_sc_{col}' # create a new column name with the prefix = pct_sc_
    percs = stats.percentileofscore(data[col],data[col],kind='weak') # calculte the percentilescore of the column
    if col in ['PE','EV_EBITDA']: # if the column is PE or EV/EVITDA then reverse the score since with this ones the smallest the better
      percs = 100 - percs + 100/len(data)
    data[new_col_name] = np.round(percs,1) # Round the score results to just one decimal point
    score_columns.append(new_col_name) # append the column name to the list for the names of the new columns
  data['SCORE'] = data[score_columns].mean(axis=1) # calculate the final score as the mean of the different scores
  data = data.sort_values(by = 'SCORE',ascending=False) # Sort the dataframe from the biggest score to the smallest one

  data = data.drop(columns = score_columns).reset_index(drop=True)

  return data
We can go further and provide some pandas styling to the DataFrame that we obtained, that way the bargains and lemons from our screener would pop out more easily. The function below allows you provide some style to the screener DataFrame, and it also allows you to save the results as an .csv file.
def return_styled_df(df,save_to_excel=False,file_name='df_score'):

  headers = {
    "selector": "th:not(.index_name)",
    "props": "background-color: #800000; color: white; text-align: center"}
  name_cell = {'selector': '',
              'props': "background-color: #281E5D; color: white; text-align: center"}
  properties = {"border": "1px solid black", "width": "65px", "text-align": "center"}

  df = df.style.format({
      "SCORE": "{:.2f} %",
      "Price":"{:.2f} $",
      "PE":"{:.2f}",
      "EV_EBITDA":"{:.2f}",
      "Rev_Growth":"{:.2f}",
      "Earnings_Growth":"{:.2f}",
      "OPS_Margin":"{:.2f}",
      "ROE":"{:.2f}"}).\
      background_gradient(subset=["SCORE"],cmap="RdYlGn").\
      set_table_styles([headers]).set_properties(**properties).\
      set_table_styles({'Name': [name_cell]}, overwrite=False)

  if save_to_excel:
    filename= f"{file_name}.xlsx"
    df.to_excel(filename)

  return df
SP500_screener = show_potential_cheap(rd,sp500_RICS)
return_styled_df(SP500_screener.head(10))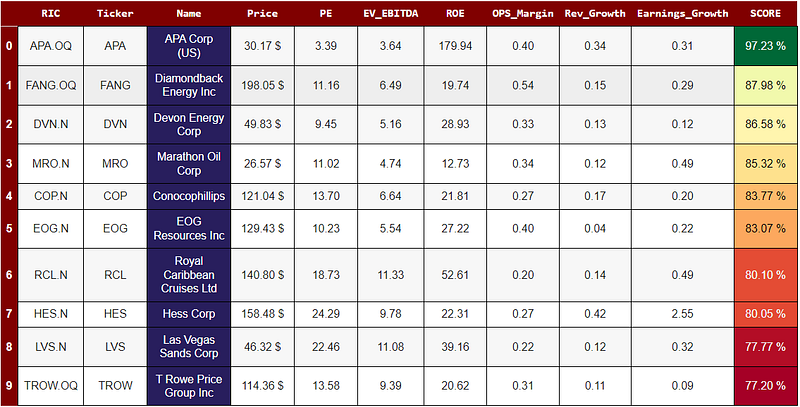
Conclusions
In conclusion, this article has taken you through a detailed explanation on how to create an stock screener using a composite scoring method, using Refinitiv LSEG python API. The notebook with all the code used in this article can be found on the following github repository.
I sincerely hope you found this article useful and entertaining. If so, I’d love to hear your thoughts! Please feel free to leave a comment or show your appreciation with a clap 👏. And if you’re interested in staying updated on my latest articles, consider following me on Medium. Your support and feedback are what drive me to keep exploring and sharing in this fascinating field. Thank you for taking the time to read, and stay tuned for more insights in my next article!
References
- https://readmedium.com/using-pythons-lseg-refinitiv-financial-data-library-from-google-colab-9135230a0440
- Damodaran, A. (2024). The little book of valuation: How to value a company, pick a stock, and profit. John Wiley & Sons.
- https://developers.lseg.com/en/article-catalog/article/summary-of-common-lseg-refinitiv-apis
- https://developers.lseg.com/en/api-catalog/refinitiv-data-platform/refinitiv-data-library-for-python/documentation#reference-guide
- https://github.com/LSEG-API-Samples/Example.DataLibrary.Python/blob/main/Quick%20Start/QS_1.0%20-%20Sessions.ipynb
- https://developers.lseg.com/en
- https://readmedium.com/lsegs-refinitiv-data-library-for-python-and-its-configuration-process-17df297e6fde
In Plain English 🚀
Thank you for being a part of the In Plain English community! Before you go:
- Be sure to clap and follow the writer ️👏️️
- Follow us: X | LinkedIn | YouTube | Discord | Newsletter
- Visit our other platforms: Stackademic | CoFeed | Venture | Cubed
- Tired of blogging platforms that force you to deal with algorithmic content? Try Differ
- More content at PlainEnglish.io


