
Build your own technical analysis stock screener using Python
An example based on the Malaysian stock market.
There are dozens of amazing stock screener apps and sites out there like TradingView. However, most sites do not offer as much customization as you want, if you don’t pay for it.
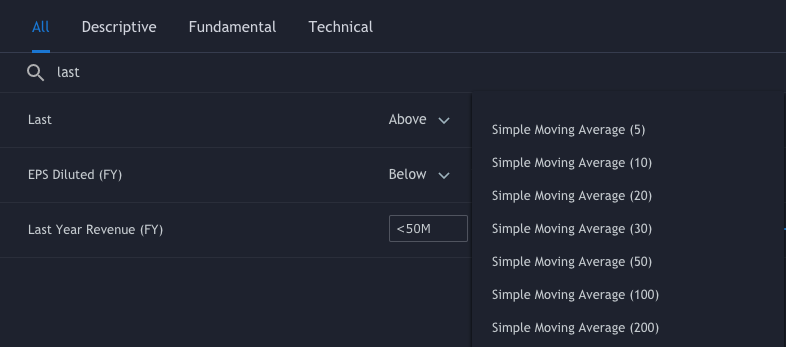

The good news is, with a few lines of Python code, you can make your own customized simple stock screener, and I am here to show you how.
If you haven’t set up Python on your computer yet, click here for the setup tutorial. If you’re totally new to Python I strongly recommend using Jupyter Notebook or Google Colab to get you started.
Step 1: Get stock prices
First things first, we need stock prices. There are, again, many great free APIs out there that allow you to access the stock prices using literally two lines of code.
import yfinance as yf
yf.Ticker("AAPL").history(start="2021-01-11", end="2021-01-15")
However, for those who have tried to do the same to the stocks listed in Bursa Malaysia (stock exchange of Malaysia), you might have come across something like this.
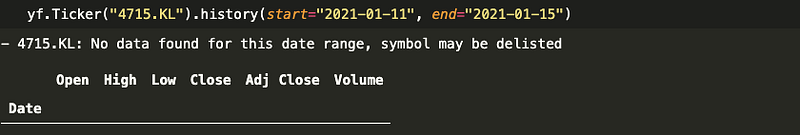
Fortunately, it’s not the end of the world. We can always try to scrape the stock data from some other stock websites. I am using i3investor in this example.
#import required modules
from bs4 import BeautifulSoup
import ast
import pandas as pd
import re
import requests
def get_stock_price(ticker):
# pass a ticker name to i3investor website url
url = "https://klse.i3investor.com/servlets/stk/chart/{}.jsp". format(ticker)# get response from the site and extract the price data
response = requests.get(url, headers={'User-Agent':'test'})
soup = BeautifulSoup(response.content, "html.parser")
script = soup.find_all('script')
data_tag = script[19].contents[0]
chart_data = ast.literal_eval(re.findall('\[(.*)\]', data_tag.split(';')[0])[0])
# tabulate the price data into a dataframe
chart_df = pd.DataFrame(chart_data, columns = ['Date', 'Open', 'High', 'Low', 'Close', 'Volume'])return chart_dfYou might realize the Date column is not really readable and to change that, you can add the following codes to convert the timestamp into readable dates.
from datetime import datetime
chart_df['Date'] = chart_df['Date'].apply(lambda x: \
 datetime.utcfromtimestamp(int(x)/1000).strftime('%Y-%m-%d'))
If you call the function by passing in a stock ticker, e.g. “GENM”, you will get the price chart dataframe as return.
price_chart_df = get_stock_price("GENM")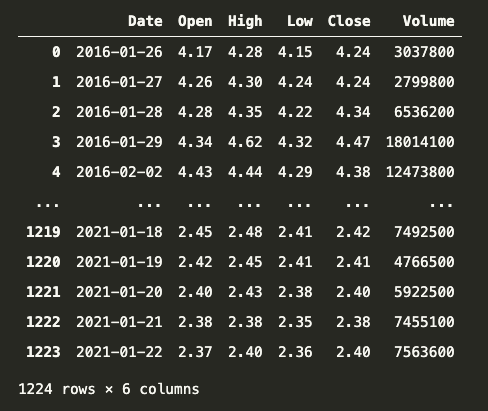
Step 2: Create technical indicators
There are numerous amount of indicators out there and the most commonly used ones would definitely be moving averages and they are extremely easy to calculate using Python. In this example, we are going to calculate some exponential moving averages (EMAs) of different periods.
def add_EMA(price, day):
   return price.ewm(span=day).mean()
# call function by passing Close prices and EMA period
price_chart_df['EMA18'] = add_EMA(price_chart_df['Close'], 18)
price_chart_df['EMA50'] = add_EMA(price_chart_df['Close'], 50)
price_chart_df['EMA100'] = add_EMA(price_chart_df['Close'], 100)
price_chart_df['EMA200'] = add_EMA(price_chart_df['Close'], 200)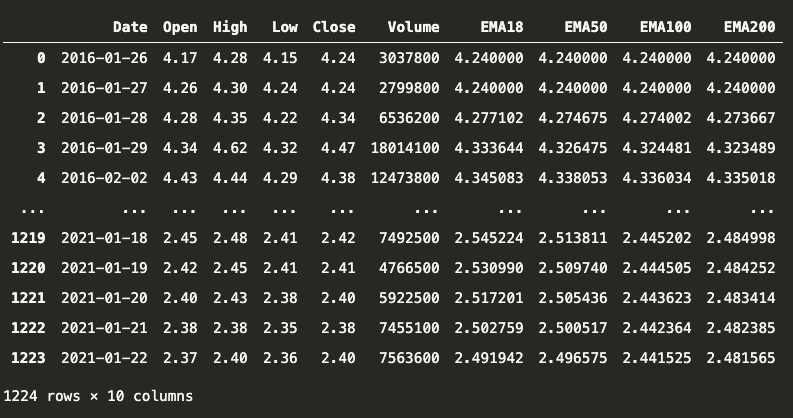
Step 3: Perform stock screening
Now we have the stock prices and the EMAs for one stock, i.e. GENM. Good, but not good enough. What we want is to be able to perform stock screening and do something like filtering out all the stocks listed in Bursa Malaysia that have say, EMA18 crossing over EMA50 the previous trading day.
To do that, we need to repeat Step 1 and Step 2 for all other Malaysia stocks and pick up those that fit our requirements. First, we need a full list of Malaysian stocks and we can scrape the data from here using the following function.
def get_stock_list():
   # this is the website we're going to scrape from
   url = "https://www.malaysiastock.biz/Stock-Screener.aspx"
   response = requests.get(url, headers={'User-Agent':'test'})
   soup = BeautifulSoup(response.content, "html.parser")
   table = soup.find(id = "MainContent2_tbAllStock")
# return the result in a list
return [stock.getText() for stock in table.find_all('a')]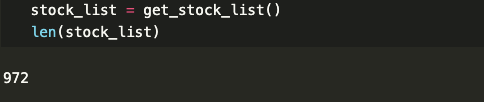
Now that we have the full stock list, we can iterate through the stock list, and in each iteration, we create a price chart (Step 1) and calculate the EMA indicators (Step 2) and check for EMA crossing. If a EMA crossing is found, the stock will be added to the screened list.
# function to check for EMA crossing
def check_EMA_crossing(df):
   # condition 1: EMA18 is higher than EMA50 at the last trading day
   cond_1 = df.iloc[-1]['EMA18'] > df.iloc[-1]['EMA50']
   # condition 2: EMA18 is lower than EMA50 the previous day
   cond_2 = df.iloc[-2]['EMA18'] < df.iloc[-2]['EMA50']
   # condition 3: to filter out stocks with less than 50 candles
   cond_3 = len(df.index) > 50
   # will return True if all 3 conditions are met
   return (cond_1 and cond_2 and cond_3)
# main program
if __name__ == '__main__':
# a list to store the screened results
screened_list = []# get the full stock list
stock_list = get_stock_list()for each_stock in stock_list:
# Step 1: get stock price for each stock
price_chart_df = get_stock_price(each_stock)# Step 2: add technical indicators (in this case EMA)
price_chart_df['EMA18']=add_EMA(price_chart_df['Close'],18)
price_chart_df['EMA50']=add_EMA(price_chart_df['Close'],50)
price_chart_df['EMA100']=add_EMA(price_chart_df['Close'],100)# if all 3 conditions are met, add stock into screened list
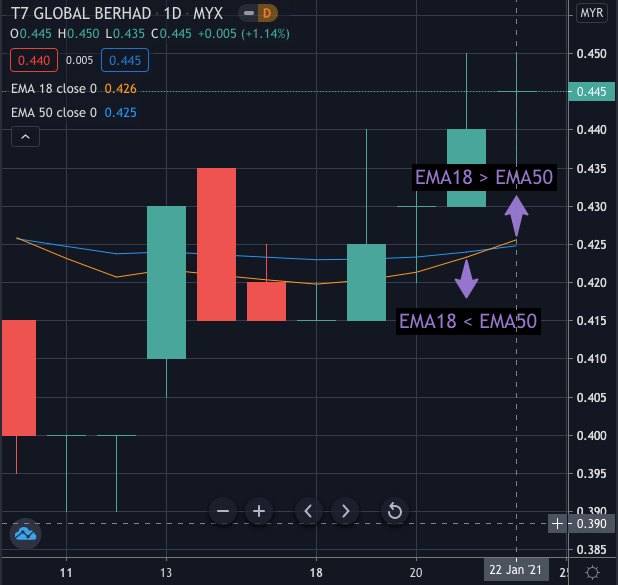
if check_EMA_crossing(price_chart_df):
screened_list.append(each_stock)Note that this program only checks for EMA crossing that appears on the last trading day, so depending on when you run the program you might get different results. At the time of writing and running the code, one of the screened stocks was T7GLOBAL and by looking at the price chart we can validate that the screening is functioning as intended.
Conclusion
We made a simple customizable stock screener that allows us to perform screening on all listed Malaysian stocks. To bring it to the next level, here are some features we can incorporate into our program:
- Add more technical analysis filters to make the program more versatile.
- Set up a scheduler to automatically run the screener every day and get the results sent to your email.
Feel free to leave a comment and stay tuned for more content like this.
Also, you can get the full code below and you can try out the code yourself on Google Colab here!
Check out my other stories here!
I am actively learning and using my programming knowledge to enhance my trading. If you like what you see and have not subscribed to Medium yet, feel free to subscribe via the link below and follow me along my journey. Thanks for your support!


