
Web Performance
How to Detect and Fix Memory Leaks With Chrome DevTools
Ready to improve your web performance?
If you prefer to watch, you can check my video course on Udemy: How to Identify, Diagnose, and Fix Memory Leaks in Web Apps.
In the last year, my team assigned me a task about fixing a performance problem in one of our Angular apps. At that moment, I was scared. I felt like I was being punished by that task.
A big part of the target app was written by me, but I didn’t know what I should do to fix it. The app was running smoothly at the beginning, but after adding new features — like inline edit for an Angular material table — it was running slower and slower and took a long time to load that the end-user was totally unhappy with it.
Armed with some knowledge learned from Addy Osmani’s tutorials, I started my mission.
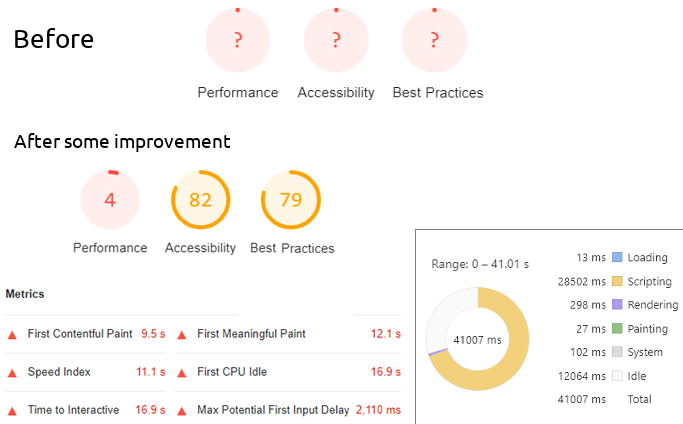
In the beginning, I was struggling. The performance was so bad that even Lighthouse could not start running with it. I got an error with Lighthouse caused by the very long First Contentful Paint (FCP) and Time To Interactive (TTI), but after a few days, my enthusiasm increased as I’d seen an improvement in the result of Lighthouse Audit and Chrome DevTools performance analysis.
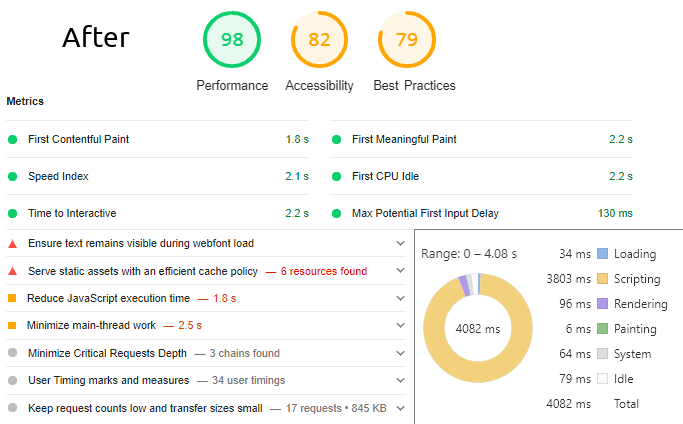
Yes, I did it. I even got very positive, encouraging feedback from the team and stakeholders after presenting what I did to achieve this outcome from the performance-tuning journey.
A few weeks later, a second Angular app, that my team was taking care of, started suffering from a similar problem but with different symptoms.
The end-users were not frustrated about the load time, but after a long session of working with the application, they realized it became slower, sluggish, and appeared to pause frequently. This time, I was not scared, but I was curious about the reason causing the problem.
After some investigation, it turned out that the culprit was a memory leak.
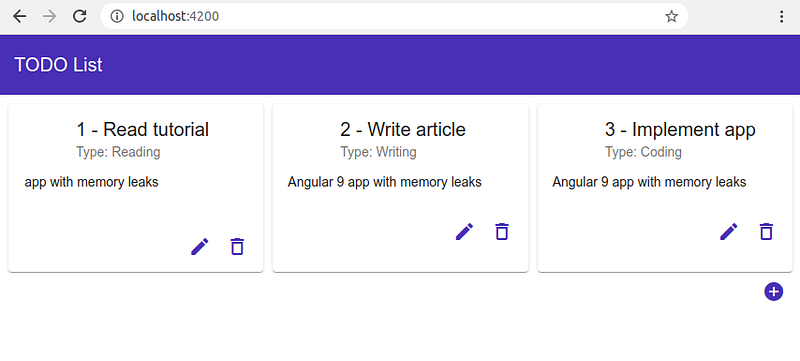
Talk is cheap. Let’s create some code and see how we can produce a web app suffering from memory leaks that damage the performance and push the users to hate it. Here is what our sample application for today will look like:
Table of ContentsProject Setup
Code
Time for Heap Snapshot
New Feature Request
Performance Timeline Record
Identify JS Heap Memory Leaks
We’ve Got a Leak — How Do We Fix It?
∘ Action 1: unsubscribing
∘ Action 2: onlySelf & emitEvent
∘ Have we fixed it?
∘ Action 3: OnPush ChangeDetection
∘ Action 4: Angular pipe & minimize subscriptions
What’s the Difference?
ConclusionProject Setup
You know the drill. Fire up your terminal, run the command ng new, and provide the name apngular-memory-leaks to create the application:
ng new angular-memory-leaks
cd angular-memory-leaks
The ng new command prompts you for information about features to include in the initial app. You can accept the defaults by pressing the Enter or Return key.
Code
Alright, time for the good stuff. We have to follow the next steps.
- Install Angular Material and Angular Flex Layout:
npm install @angular/material
npm install @angular/cdk
npm install hammerjs
npm install @angular/flex-layout- Import Angular theme by adding this line to
src/style.scss:
@import "~@angular/material/prebuilt-themes/indigo-pink.css";- Generate two new components,
todo-listandtodo-dialog:
ng generate component todo-list
ng generate component todo-dialog- Update
app.module.ts:
- Replace the content of
app.component.htmlwith the following:
- And this is what
todo-list.component.htmlis looking like:
todo-list.component.css:
todo-list.component.ts:
todo.dialog.html:
todo.dialog.ts:
- As you have noticed,
todo-list.component.tsandtodo.dialog.tsare usingtodo.service.ts, which is providing the types and the list of all todos. Right now,getTodos()andgetTypes()methods are reading two constants, but you can adjust them in your case to get real data from your back end with a REST call:
This is the result after running ng serve and call localhost:4200 with the browser:
Time for Heap Snapshot
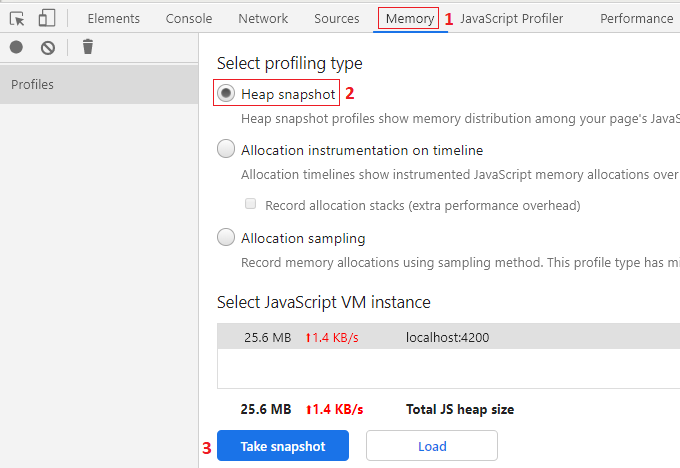
Great! Let’s see some statistics with Chrome DevTools (F12). We will take two Heap snapshots that show us how memory is distributed among our app’s JavaScript (objects, primitives, strings, functions, DOM nodes, etc.) at the point of time of the snapshot.
- Open the Memory panel on DevTools after reloading your page (F5).
- Enable the Heap snapshot checkbox.
- Click on “Take snapshot” button. “Snapshot 1” is ready now.
4. Play with your web app: Create eight new todo cards with the todo dialog (click on the plus “+” button).
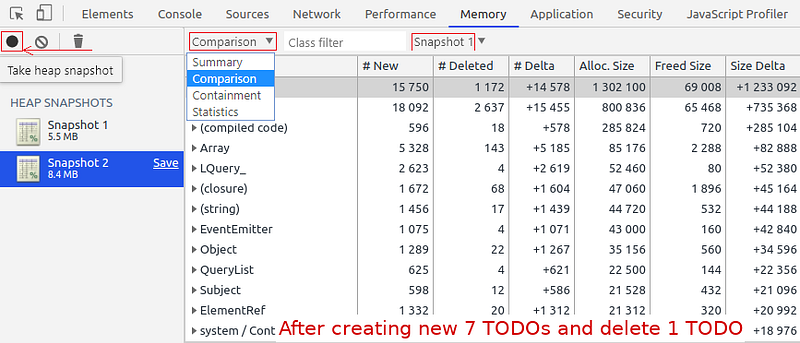
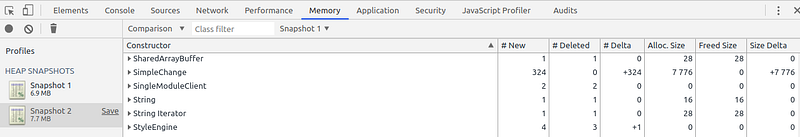
5. Then click on the “Take heap snapshot” icon to take a second one. The second recorded snapshot will have a bigger size than the first one: 8.4 Mb instead of 5.5 Mb.
6. Click on Summary, then select Comparison to see the difference. Under column “# New,” there are the newly allocated objects in the second snapshot (new arrays, closures, Event Emitters, Subjects, …). Under column “# Deleted,” there are the deleted objects.
New Feature Request
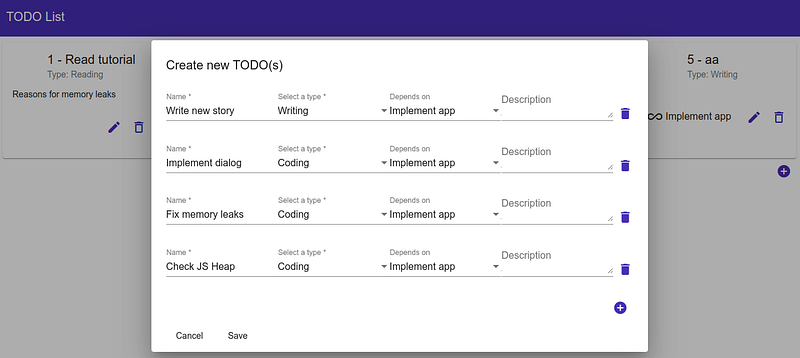
We can start adding some useful functionalities, such as use the todo dialog to create not only one todo but multiple ones at the same time, and add a condition to the “Depends on” drop-down in the todo dialog:
- a todo of type “Writing” may depend on the three todo’s types: “Writing,” “Reading,” or “Coding.”
- a todo of type “Reading” or “Coding” may depend only on “Reading” or “Coding.”
For this implementation, we will use Angular FormArray and subscription to valueChanges of the type’s field. You have to update todo.dialog.ts: as following:
todo.dialog.html:
We will remove createTodo() and updateTodo() methods and use openTodoDialog() method instead in todo-list.component.ts andtodo-list.component.html:
We have to adjust the updateTodoList() method in todo.service.ts:
The new todo dialog layout:
That’s pretty nifty. It’s time for some truth now. You need to repeat the previous steps 1 to 6 to compare two new heap snapshots for the current status (an initial one and a second one after the scenario of creating a list of many todos). The outcome will be similar to the following:
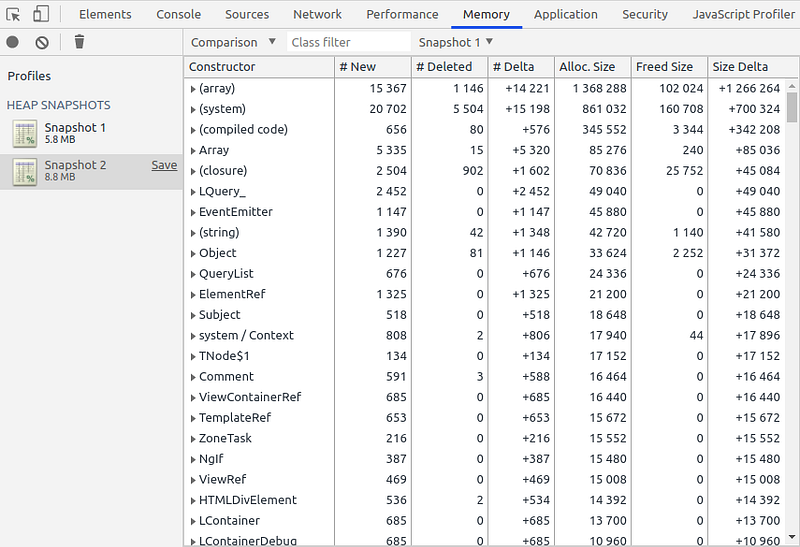
As you can see, the required heap size is increased by 3 MB in the second snapshot. Many new objects, listeners, arrays, DOMs are created, but none or few of them are deleted.
Performance Timeline Record
Let’s translate this with a performance record. Open the Performance panel on DevTools, and then enable the Memory checkbox and make a record.
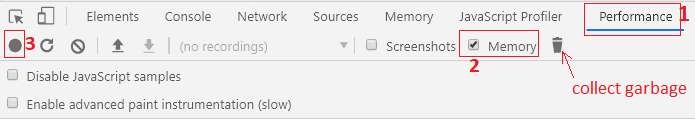
After you click on the Start button and before stopping the record, you need to play with the application: Open the todo dialog multiple times, create new todos, add new forms to the dialog, delete some of them with and without save, and update some todos. Stop the record and wait until you can see the result:
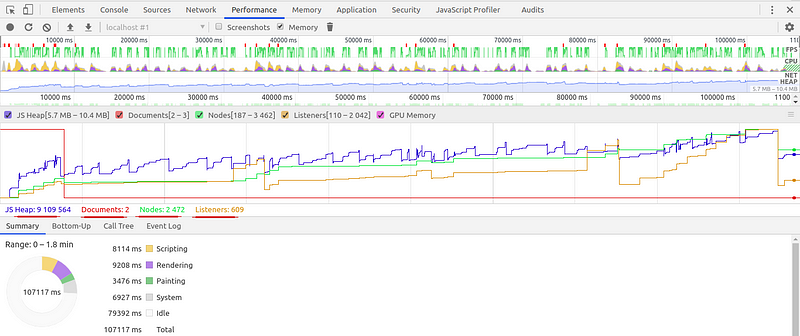
What’s going on here?
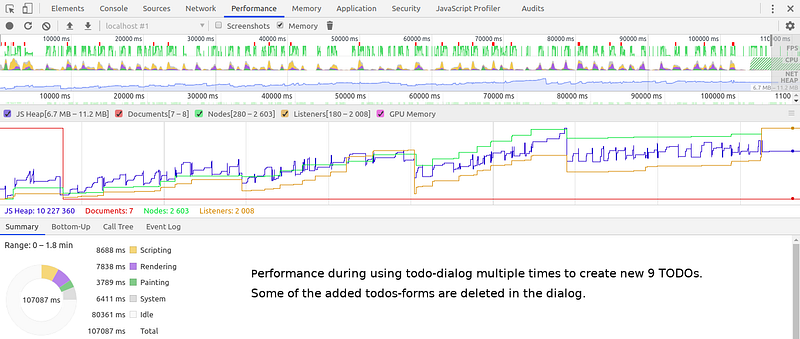
Chrome and DevTools offer us the possibility of finding memory issues that affect page performance, including memory leaks, memory bloat, and frequent garbage collections. In the above record, the memory usage is broken down by:
- JS heap (the memory required by Javascript, blue line)
- Documents (red line)
- DOM nodes (green line)
- Listeners (yellow line)
- GPU memory
We notice the JS heap ends higher than it began. In the real world, if you see this pattern of increasing (JS heap size, node size, listeners size), it might mean a memory leak. A memory leak occurs when an application fails to get rid of unused resources and the user realizes that at some point, the application is slower, sluggish, and will probably pause frequently, which is a symptom of potential garbage collection issues.
In performance timeline recording, frequently rising and falling JS heap or node count graphs mean frequent garbage collections (vertical blue lines), which is the case in our example.
Identify JS Heap Memory Leaks
- Open DevTools
- Go to the Memory panel.
- select the “Allocation instrumentation on timeline” radio button.
- Press the Start button (black circle).
- Perform the action that you suspect is causing the memory leak.
- Then press the “Stop recording” button (red circle) when you’re done.
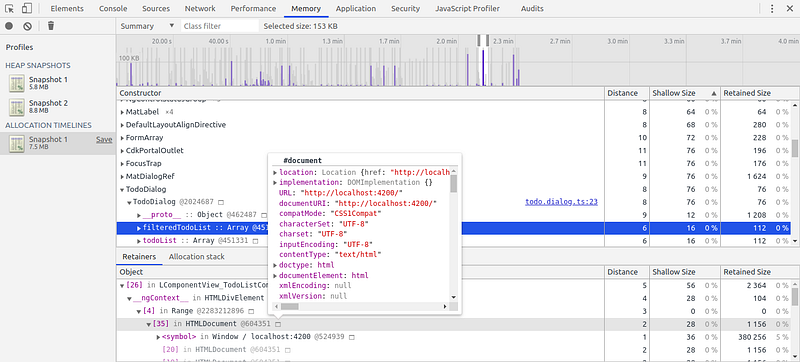
Every blue vertical line is an allocation of memory for some JS objects. You can select a line with your mouse to see more details about it.
We’ve Got a Leak — How Do We Fix It?
Here are a few things that might cause memory leaks in an Angular app:
- Missing unsubscription, which will retain the components in the memory
- Missing unregistration for DOM event Listeners: such as a listener to a scroll event, a listener to forms
onChangeevent, etc. - unclosed WebSocket connections when they are unused
- Detached DOM tree: A DOM node could be garbage-collected when there are no global references to it. A node is said to be detached when it’s removed from the DOM tree but some JavaScript still references it. Such a case could be identified by comparing two Heap snapshots and then scrolling down to elements prefixed by Detached under the Constructor column.
When an object is not referenced anymore by something reachable from a global object, it will be reachable by the garbage collector. Objects referencing each other but at the same time not reachable from the root will be garbage collected.
Performance tuning action 1: unsubscribing
Our todo app is already suffering from the first-mentioned two common causes for memory leaks. Each time a need for subscribing to observable arises, it will produce a Subscription object, which, when the component gets destroyed by Angular runtime, should be handled in a way that will not cause memory leaks in the JavaScript runtime — that means calling unsubscribe(), usually inside the ngOnDestroy method of the component.
After maintaining the subscription to formGroup.get('type').valueChanges and removing the subscription to formGroup.valueChanges (since it’s not needed), we added the missing unsubscriptions in todo.dialog.ts and todo-list.component.tsas follows:
Performance tuning action 2: onlySelf & emitEvent
For more fine-grained control over the changes propagation and the DOM events emit, we can use onlySelf: true and emitEvent: false to prevent a form field’s change from triggering the onChange method of its ancestors (the whole form or the list of all forms in the dialog).
Before removing the listener to FormGroup valueChanges, you may have noticed that after each change of the value in the Type drop-down, there were two log messages displayed on the browser’s console: one from console.log('form value changed') and the other one fromconsole.log('type changed') because triggering the field event listener was propagated to the parent DOM event listener.
Whenever an unneeded todo form is deleted (with delete icon), you have to remember to unsubscribe from its listeners:
Have we fixed it?
Go and repeat the previous scenario, and then take a performance timeline record for it. See what happens; I’ll wait here. Notice anything interesting? Is there a big difference?
I don’t think so. This improvement was no silver bullet. There’s a bit more slapped onto these memory leaks. So, let’s continue our optimization mission.
Performance tuning action 3: OnPush ChangeDetection
Instead of the default Angular ChangeDetectionStrategy, I used the OnPush strategy in todo dialog:
Performance tuning action 4: Angular pipe & minimize subscriptions
I implemented a custom pure pipe and used it in the selectBox field. The subscription to type’s valueChanges is not needed anymore now.
Please remember that an impure pipe is called often, as often as every keystroke or mouse move, and that an expensive, long-running pipe could destroy the user experience.
Don’t forget to add FilterPerTypePipe to the declarations part in app.module.ts:
I removed the subscription to todoService.getTodos() in the dialog since todoList is already available in the todo list component and can be added to TodoDialogData. I also moved the subscription to todoService.getTypes() to the todo list component. No injection for TodoService is required in TodoDialog:
What’s the Difference?
Here are the final Chrome DevTools statistics after the last optimization step. During the record, I’ve executed almost the same example scenario: create nine new todos by using the dialog three times, add and remove some forms, click one time on the Cancel button of the dialog, and update one todo by adding a dependency to it.
- At the end of the scenario, JS Heap size in the performance timeline record was ~9 MB instead of ~10 MB (hover your mouse on the graph to see it).
- The number of documents was two instead of seven in our first performance record.
- The number of listeners was 609 instead of 2,008.
- The JS Heap in the second snapshot was increased by 0,8 MB — after creating nine new todos — instead of 3 MB as at the beginning of our tutorial.
- There is much less garbage collection → The problem of frequent garbage collection is alleviated.
That makes sense, doesn’t it?
The complete Angular 9 todo application is available under this GitHub repository.
Final Thought
Building large applications entails writing lots of code, complex pages, long lists, and many components and modules. Angular is a framework that does a great job of memory management. Nonetheless, some scenarios led to mistakes, resulting in memory leaks and, as a consequence, a crippled user experience. We won’t know that possibly we caused this problem until it shows up in production.
Users reload pages less and less often. They lose focus on the tasks they are performing when performance delays are beyond one second. Beyond 10 seconds, users are frustrated and are likely to abandon tasks. They may or may not come back later. That’s why keeping performance optimal for long-lived sessions is essential.
Debugging memory leaks issues can be a daunting task, and avoiding them requires awareness about the issue and constant vigilance.
🧠💡 I write about engineering, technology, and leadership for a community of smart, curious people. Join my free email newsletter for exclusive access or sign up for Medium here.
You can check my video course on Udemy: How to Identify, Diagnose, and Fix Memory Leaks in Web Apps.


