
Beautify the PowerBI Reports — Layout and Navigation

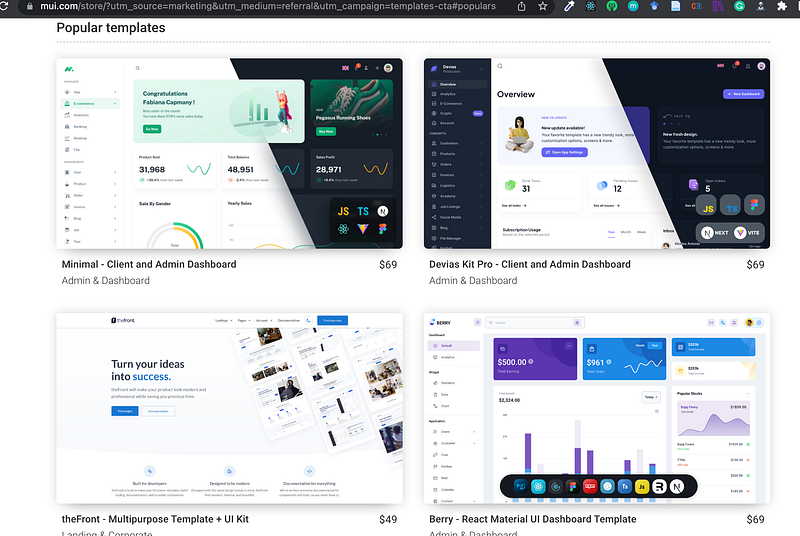
I was amazed by those PowerBI dashboards (see: Top 3 PowerBI Dashboard Examples) and managed to figure out that they were built by pre-setting some backgrounds to neatly layout the page (see: Beautify the PowerBI Reports — Basic Graphs). I encountered similar kinds of layouts four years ago when I was building websites using React.js. The design concept is called Material UI, which was developed by Google. I highly recommend spending some time to understand this concept. There was a popular library(MUI) that facilitated the quick building of this kind of layout, and here are some templates. Later, when using either Tableau or PowerBI, I saw many similar dashboards. I’d say that building a dynamic and interactive PowerBI dashboard is very much like building a webpage. The key difference is that PowerBI is codeless. PowerBI offers features that allow you to build navigation bars and buttons similar to those found on websites, which I’d like to share here:
- Using shapes, lines, and colours to build up the layout
- Using buttons to navigate among pages
- Using bookmarks to frame a navigation bar
- Inspiring dashboard designs for your reference
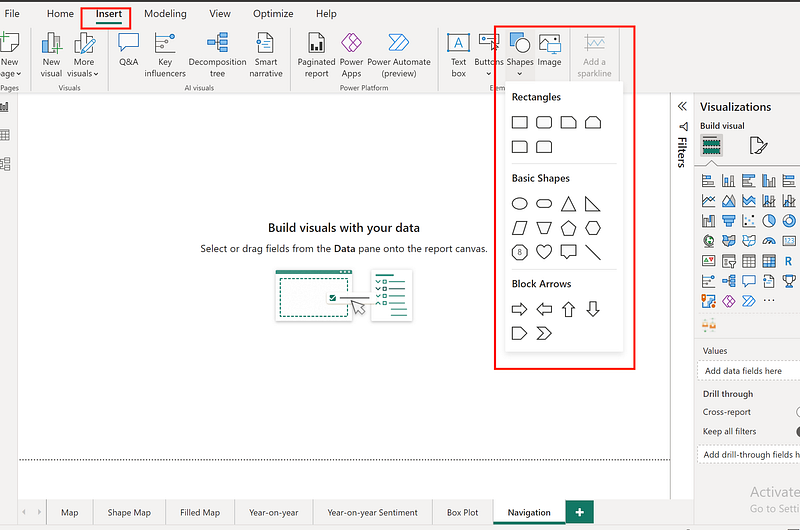
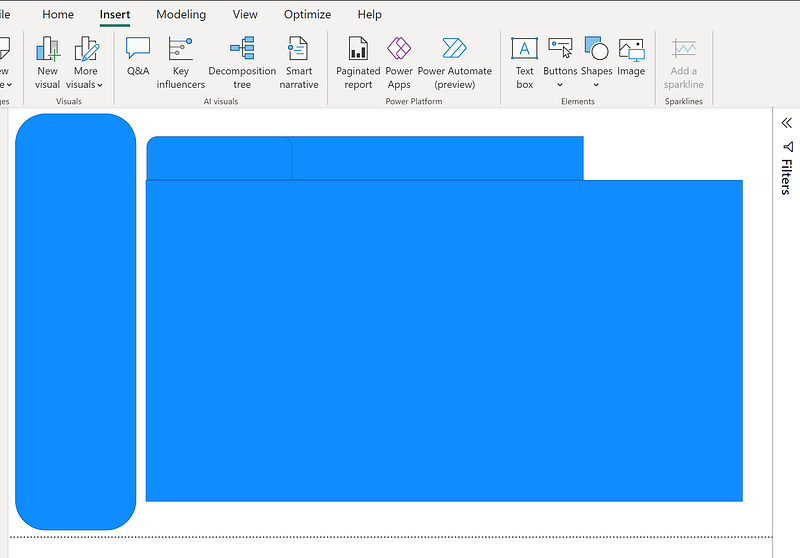
1. Using shapes, lines, and colours to build up the layout
As mentioned earlier in this post, we can use shapes to establish the layout. The process of inserting shapes and adjusting lines and colours is the same as you would in PowerPoint, and it’s similar to building a webpage in a What-You-See-Is-What-You-Get (WYSIWYG) manner, without coding. The key lies in graphic design. Here is a 30-minute introduction to that concept from Canva: Graphic Design Basics.
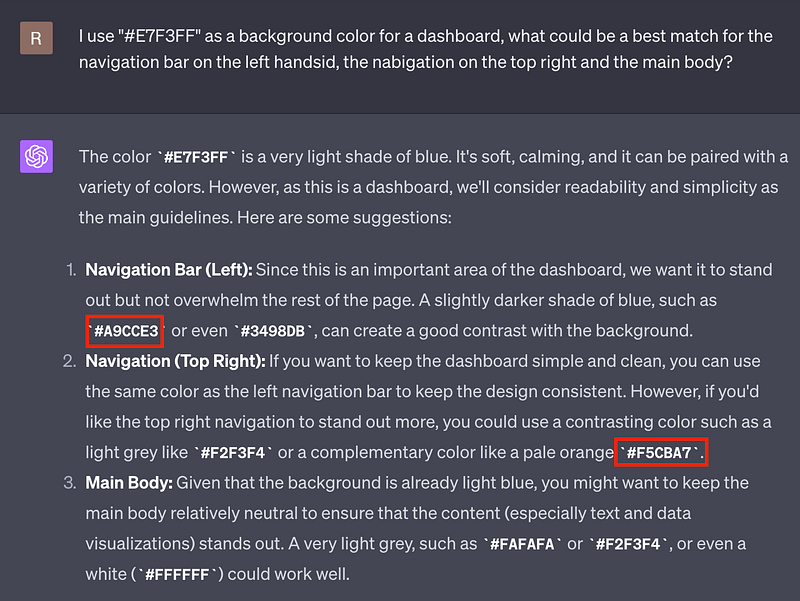
I am bad at design, so I asked ChatGPT to suggest some colours to match my light blue background (#E7F3FF). Take a look below.
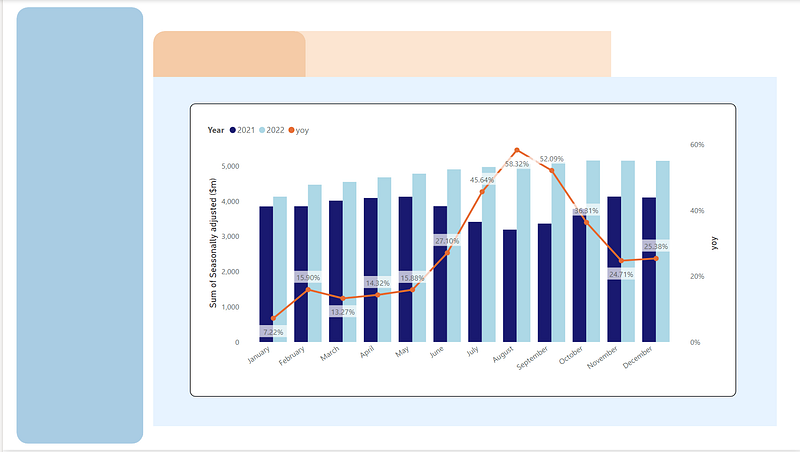
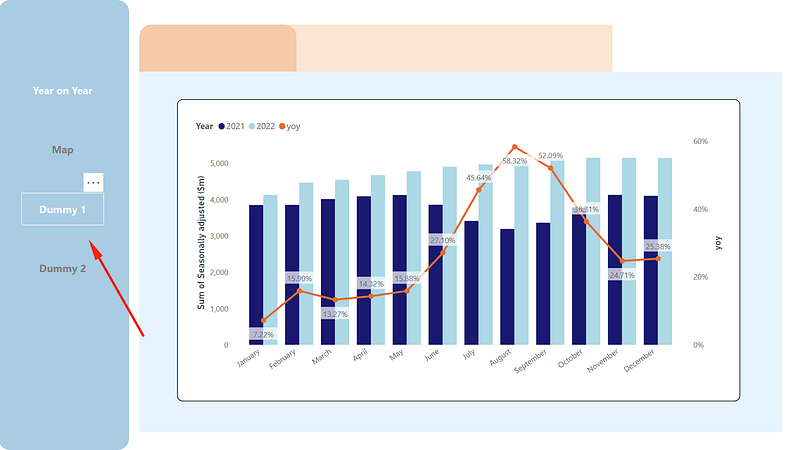
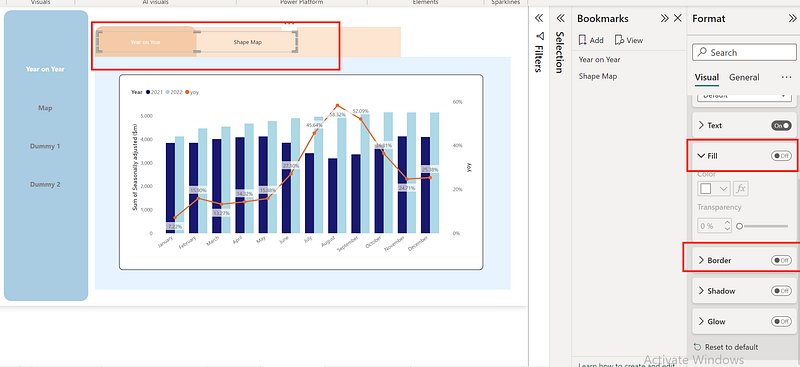
Using the charts I created from the previous posts (Beautify PowerBI Reports: Year-on-year Charts)
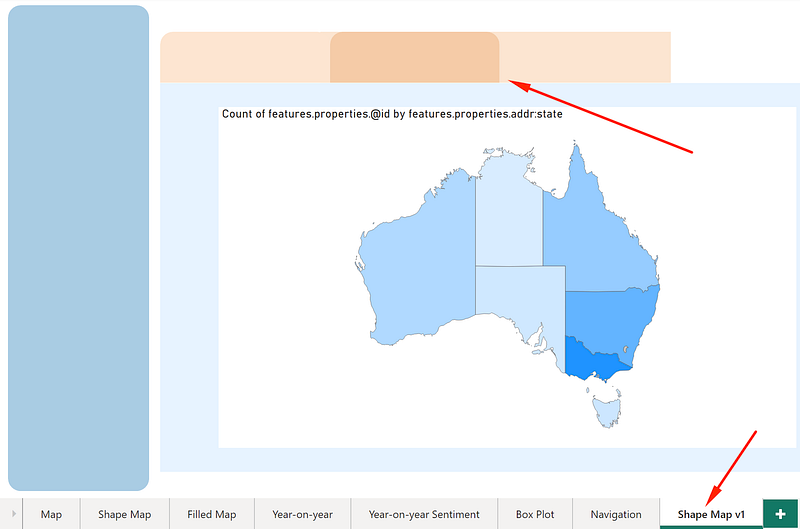
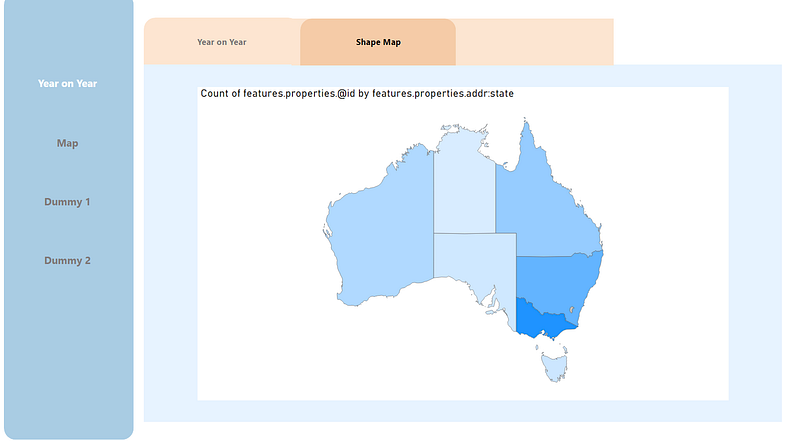
You might have noticed how the background of the bookmarks in the top right corner changes. This creates a feeling of navigation, as though you’re switching from the “Navigation” page to the “Shape Map v1” page. (You can find how to create the shape map here: Beautify the PowerBI Reports — Maps).
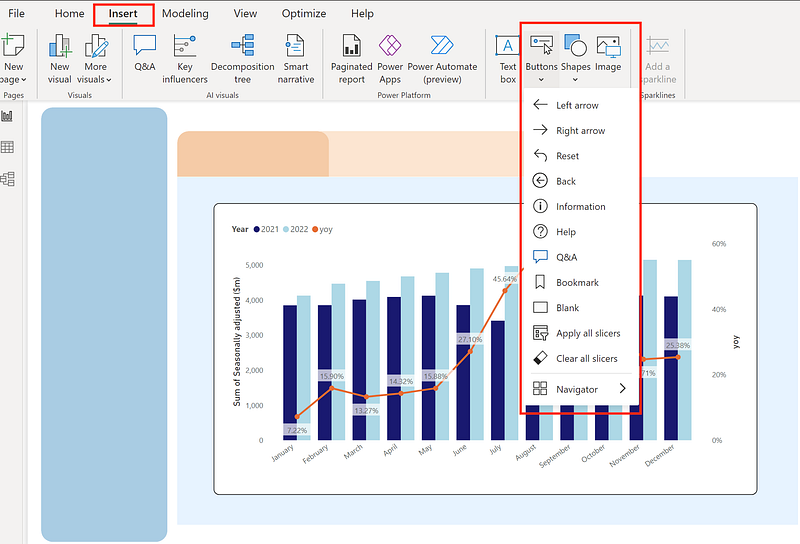
2. Using buttons to navigate among pages
Now, add the buttons on the navigation bar on the left.
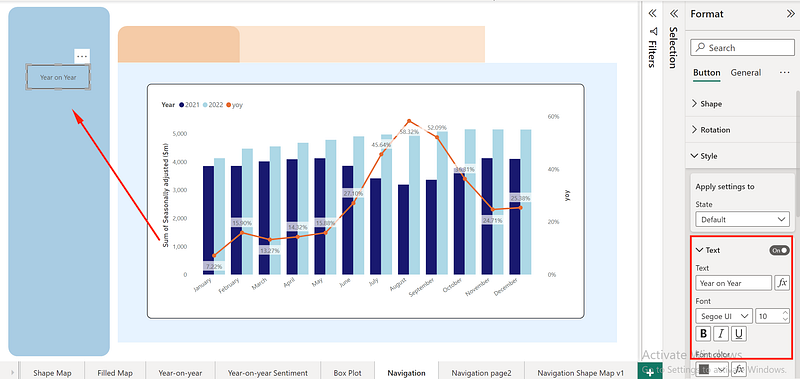
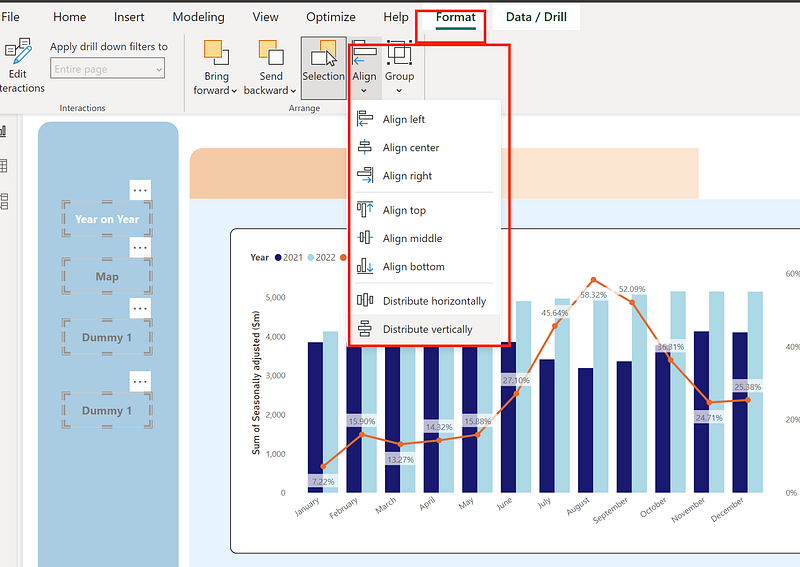
I made the activated page with white text colour, the rests are grey. Distribute vertically using the Align tool.
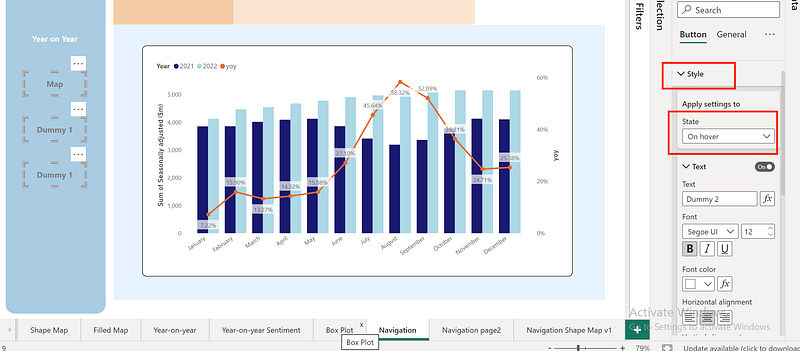
Update the colour to white when hovering over it.
Now, let’s connect the button with destinated page.
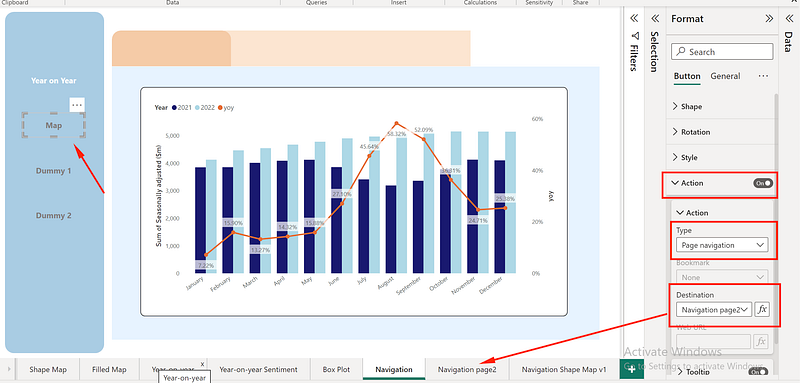
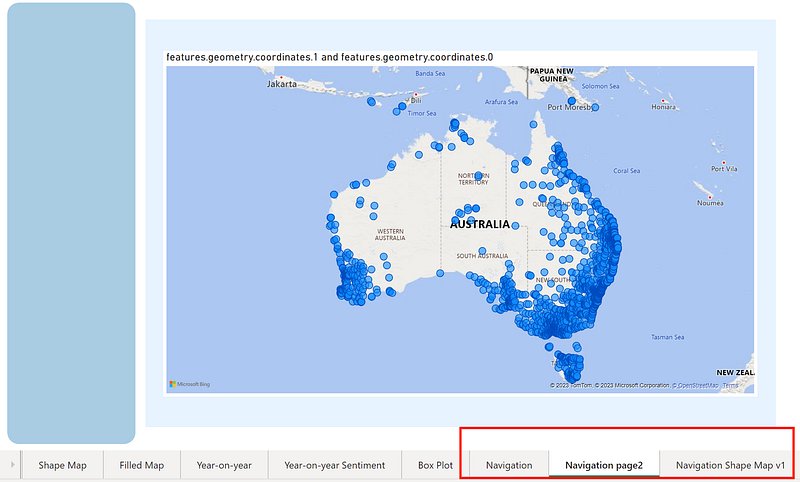
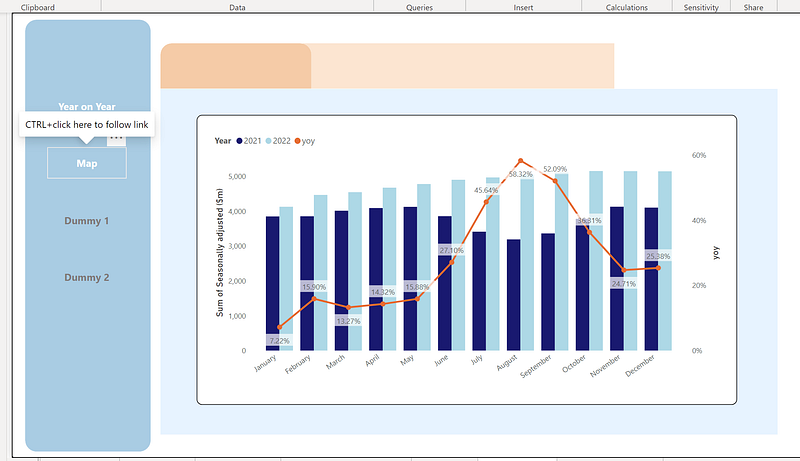
When you hold ctrl+click you will jump to the map page “Navigation page2”. We are in the edit mode, users only need to click when your report is published.
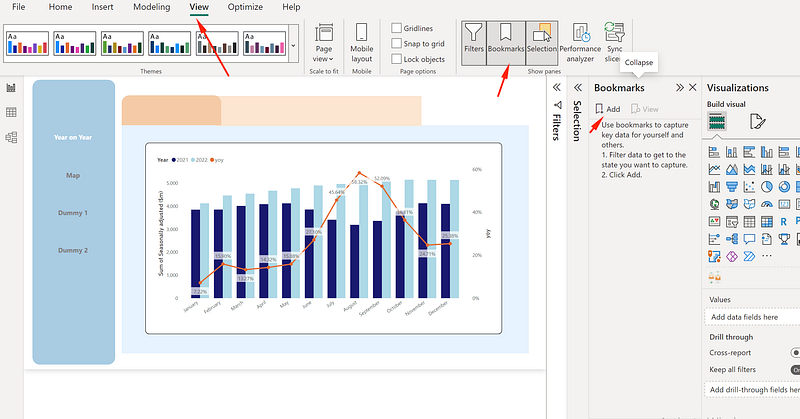
3. Using bookmarks to frame a navigation bar
You can apply the same technique mentioned above to the navigation bar at the top right, or you can utilize bookmarks as follows.
First, create some bookmarks. It’s worth noting that bookmarks are useful when you have filters in place. They can mark the views under different filter conditions. In this instance, I’m simply using page navigation for convenience.
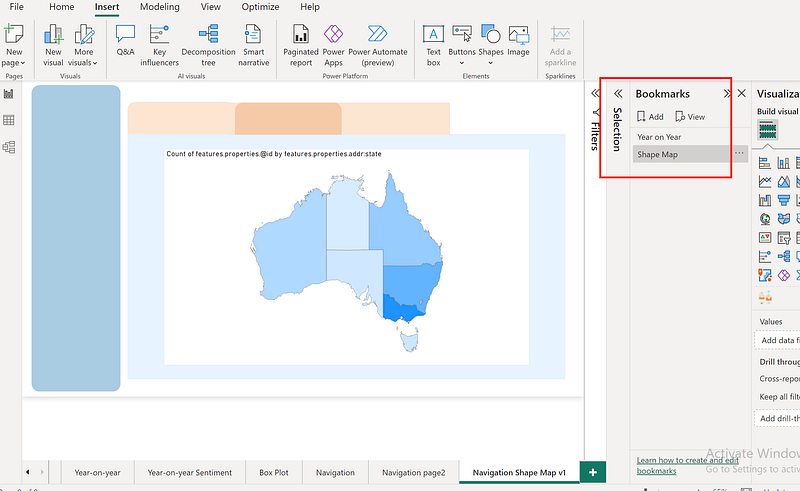
PowerBI can generate the bookmarks for you automatically by inserting a bookmark navigator under the buttons.
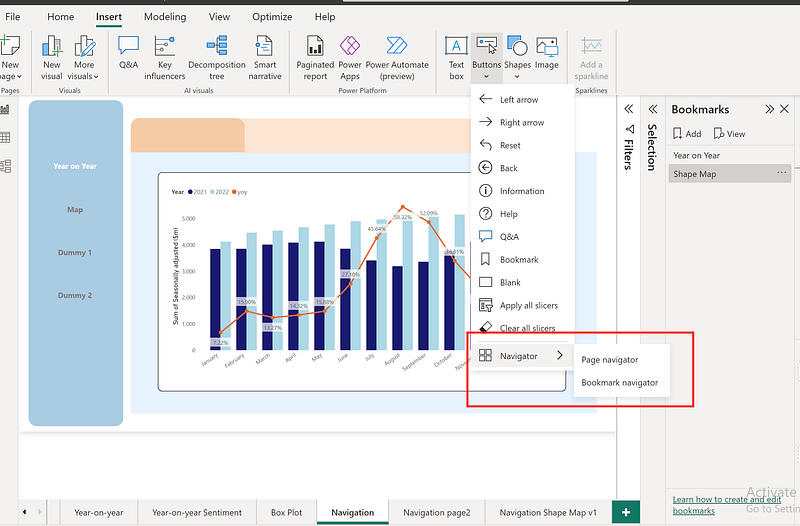
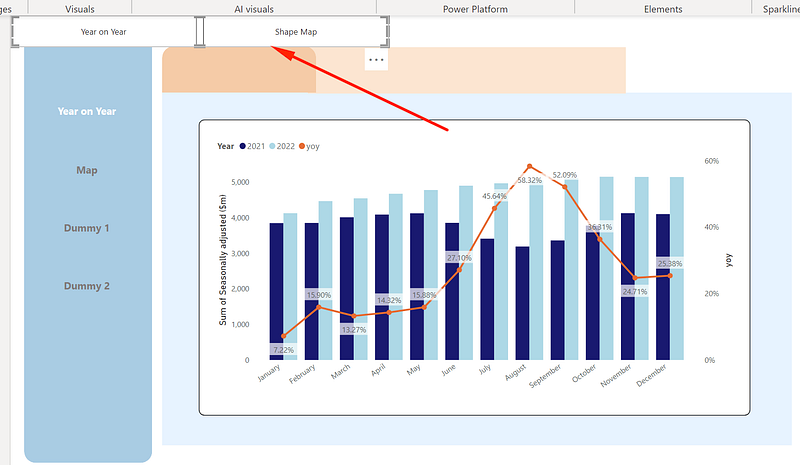
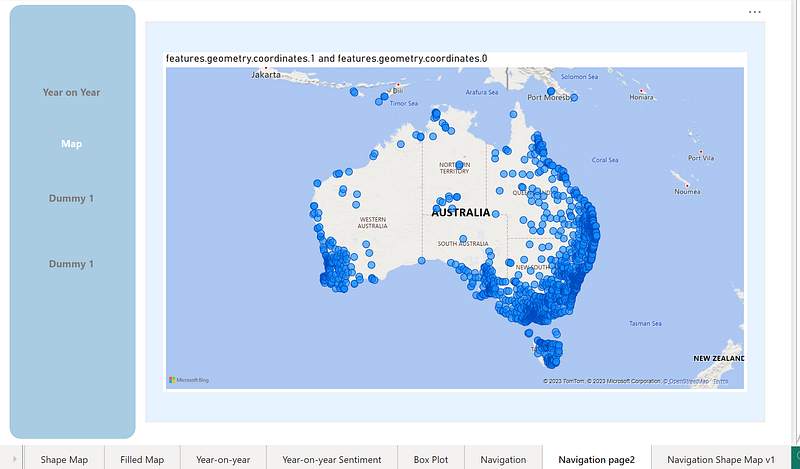
Move it around and turn off the fill and border, also copy and paste this visual to the other page (shape map in this case).
Now, when you use ctrl+click it can jump to the shape map. (I changed the selected colour to black and defaulted to grey)
Here is the PowerBI ‘s documentation on this topic Create page and bookmark navigators.
4. Inspired dashboard designs mastering layout, alignment, colour, etc
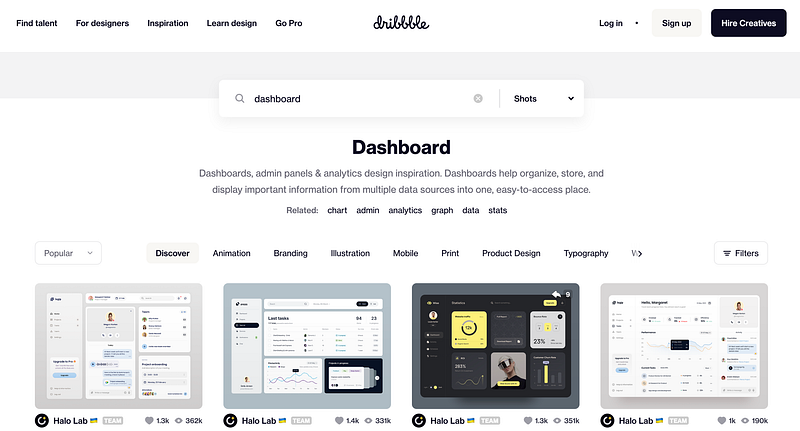
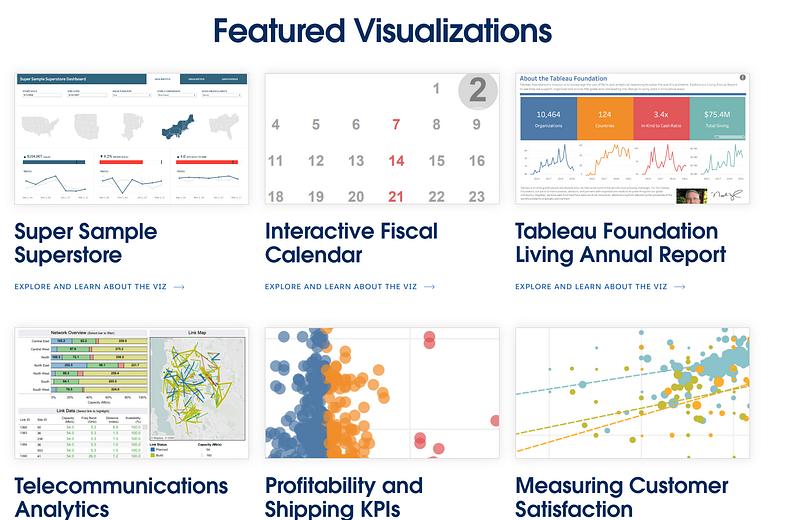
Using the techniques mentioned above, we can create all sorts of dashboard designs. As this involves general dashboard design rather than PowerBI-specific design, you might be surprised at how many sources can provide design inspiration.
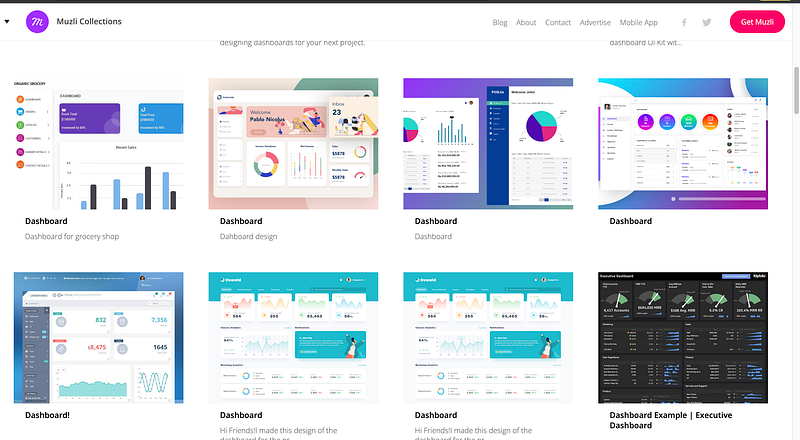
(2) Muzi Dashboard
(3) PowerBI and Tableau Community of course
Similar posts on this topic:
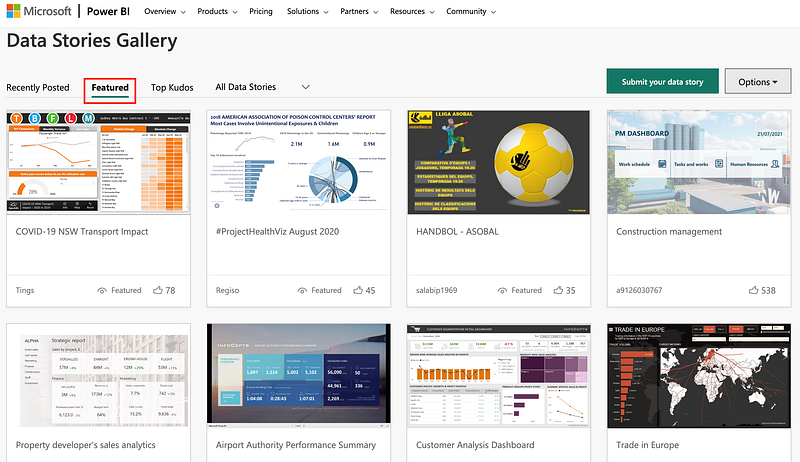
- Top 3 PowerBI Dashboard/Report Examples
- Beautify the PowerBI Reports — Basic Graphs
- Beautify the PowerBI Reports — Maps
- Beautify the PowerBI Reports: Year-on-year Charts
- Beautify the PowerBI Reports — Box Plots
If you found this post helpful, please consider clapping for it or following me. Thank you for your appreciation and support.
Don’t forget to subscribe to our:
👉Power BI publication
👉 Weekly Power BI Newsletter


