
Algorithmic Trading Using Python
How to backtest Trading Strategies using Python feat. Moving Averages.
Leverage historical data for backtesting the MA crossover trading strategy.
- Imagine a computer program continuously monitoring markets and executing profitable trades on your behalf without any manual intervention. Sounds exciting but way riskier, doesn’t it?
- The idea sounds risky because of the uncertainty associated with automated decision-making.
- The goal of this blog post is to demystify algorithmic trading by piggybacking on historical data to help us make an informed decision.
- Algorithmic Trading is the use of predefined conditions for entering and exiting trades when the markets are in session. These predefined conditions are also known as trading strategies.
- A strategy can be defined using an IFTTT (If This Then That) rule or by leveraging fancy ML algorithms predicting the price action for a given ticker.
- The internet is flooded with trading strategies that promise handsome returns.
- However, I personally, am a cautious trader and a big believer of the quote “In God we trust, All Others Must Bring Data”, by W Edwards Deming.
- One way to enter a trade with higher confidence is to leverage the concept of backtesting.
- Backtesting, in general, is a method for testing a predictive model or a strategy by using historical data.
- In this blog post, I will introduce the Moving Average Crossover strategy and implement the code for backtesting it for any given ticker.
The rest of the article is structured as follows -
- The Good Old Moving Averages.
- The Moving Averages Crossover Strategy.
- Introduction to Alpha-Vantage, a FREE* API for fetching stock prices.
- Python Implementation of the strategy.
- Evaluating and Visualizing Results.
TL;DR
- If you are familiar with the Moving Averages Strategy and are only interested in the Python code, check out the Jupyter notebook for backtesting the moving averages strategy for any ticker of your choice.
The Good Old Moving Averages -
- When dealing with time-series datasets, moving averages play a pivotal role in applications including smoothening, trend analysis, identifying seasonality, etc.
- Some of the widely used time series models include the Simple Moving Averages model (SMA), Exponential Weighted Moving Averages model (EWMA), Autoregressive Moving Averages (ARMA), Autoregressive Integrated Moving Averages (ARIMA), and ARIMAX (ARIMA with exogenous variables).
- To keep things relevant, we shall only discuss the mathematical setup for SMA and EWMA models.
- In a Simple Moving Average model of order n, the value at time t is determined by computing the average of past n observations in the time series.
Mathematically,
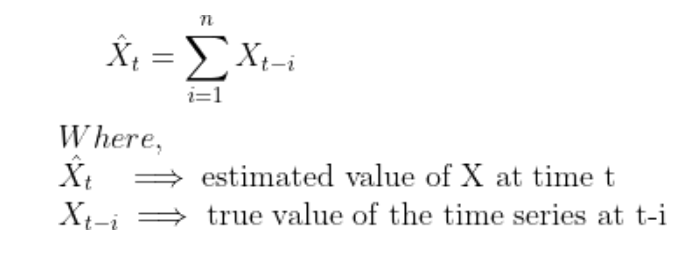
- One of the drawbacks of the SMA model is that it assigns equal weight to every data point in the past. This induces a lag in the estimates and makes it trickier to capture trend reversals.
- The Exponential Weighted Average Model solves this problem by assigning a higher weight to recent data points as compared to the older data points. This enables the time series model to be more sensitive to changing trends as compared to the SMA model.
Mathematically,
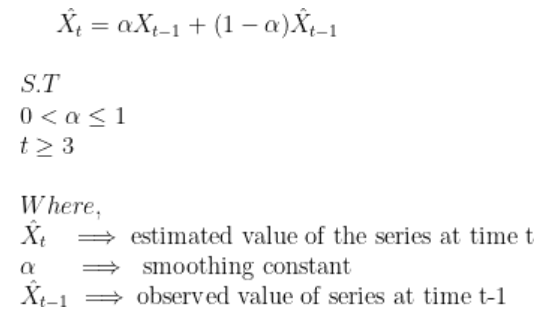
For a more detailed investigation of the nuts and bolts involved in modeling a time series using EWMA, I would highly recommend checking the NIST Engineering Statistics Handbook.
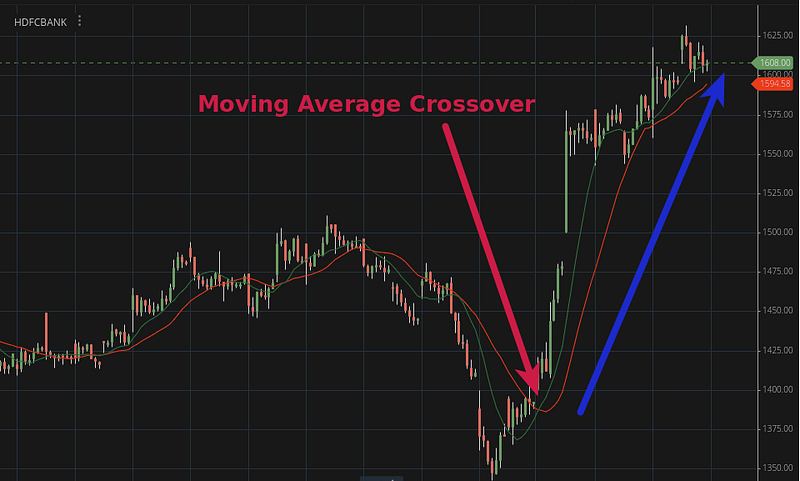
The Moving Averages Crossover Strategy —
- A possible trend reversal opens up an opportunity for initiating a trade.
- In this section, we shall leverage moving averages to identify a change in trend for any given ticker.
- The Moving Averages crossover strategy involves the use of a longer-term (n) MA and a shorter-term MA (m) for the same chart.
- The shorter-term MAs will help us capture the short-term changes in stock prices whereas the longer-term MAs will help us keep track of stock prices over a longer period.
- As a result, the strategy gives a buy signal when the shorter-term MA crosses above the longer-term MA, indicating an upward trend for the stock prices. This crossover is also known as a Golden cross.
- Similarly, the strategy gives a signal to sell when the shorter-term MA crosses below the longer-term MA, indicating a downward trend for the stock prices. This cross is also known as the Death cross.
With the details of the strategy laid out, let us take a look at a historical trade setup.
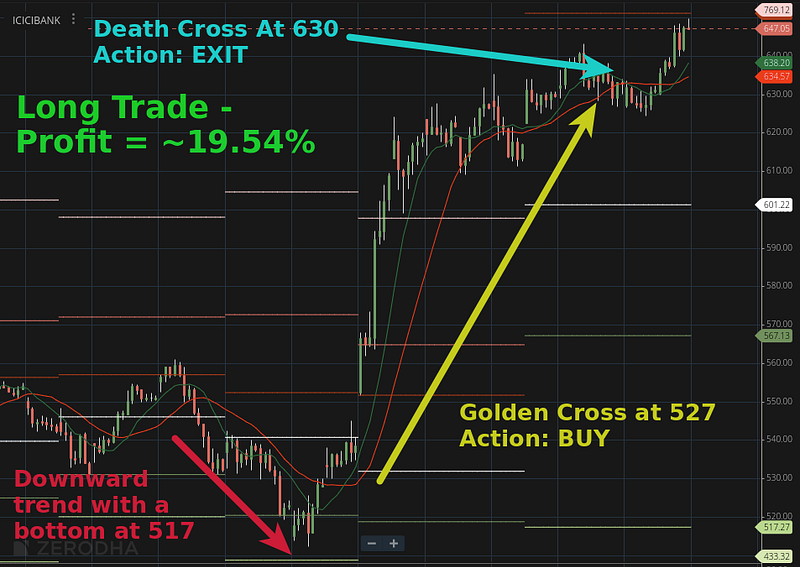
- The above screenshot demonstrates a long trade setup for
ICICIBANK-NSEover a period of 15th January 2021–11th February 2021 using an hourly candlestick timeframe. - It can be seen that the stock price for ICICBANK-NSE kept consolidating till a price of 517 INR before beginning the upward movement. A golden cross was observed at the price of INR 527 indicating a long trade setup.
- The prices continue to rise until a death cross is observed at INR 630 indicating a sell/exit signal. This long trade paid a handsome return of 19.54% over a period of 25 days. Pretty impressive.
- Similarly, one can identify a historical short trade where you enter a trade when a death-cross is encountered and exit when a golden-cross is witnessed.
THE END ??
Most blogs would end at this point but there are a few of unanswered questions that are typically out of scope.
- Can we generalize the MA crossover strategy to any other ticker across the stock exchanges?
- Does one size fit all? Every mathematical model consists of certain configurations and hyper-parameters that can have a direct impact on a strategy's success. For instance, the MA crossover strategy involves the choice of candlestick timeframes, the time-series model used, and the order of time series used. How do we find the configuration that works the best for a given ticker?
- Is there a way to get an estimate on the expected percentage of returns before entering a trade using the MA crossover strategy?
In the following section, we shall implement the Moving Average Crossover strategy using Python to answer the above-mentioned questions and reach an informed decision.
Introduction to Alpha Vantage and Toucan —
- Before jumping into the python implement, we need a way to fetch the stock prices for tickers across timeframes.
- Alpha vantage provides an API for fetching stock prices across dimensions and time-frames.
- All you need to get started with Alpha Vantage is the free API key. For more information, check out their official AV documentation.
- Toucan is a public GitHub repository currently maintained by me on the sidelines. It consists of python wrappers for interacting with AV API and for analyzing the strategies.
With all the bases covered, let us jump right into the code.
Step 1. — Load Data for a Ticker.
- We shall load daily data for Microsoft — ‘MFST’
Step 2 — Compute Moving Averages.
- Define the slow and fast-moving average periods.
- Compute moving averages using either the SMA model or EWMA model. For this blog post, I have used the EWMA model but Toucan supports the SMA model as well.
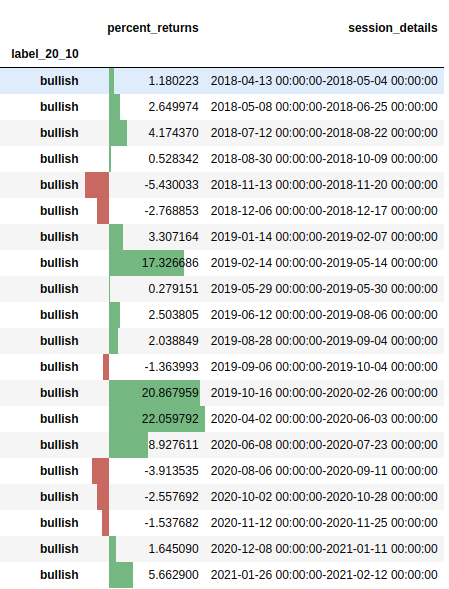
Step 3 — Annotate Sessions and Compute Returns
Step 4 — Visualize & Analyze estimated returns
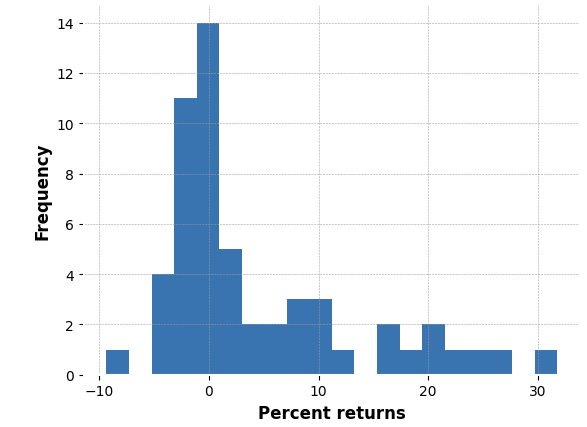
Estimated expected returns (%) = 4.39%
Step 5 — Make an Informed Decision
- Based on the analysis and backtesting performed in the last 4 steps, the expected returns on the MA averages strategy for Microsoft is 4.39%.
- Like any other trading strategy, there are a few false positives as seen from the histogram with the worst trade setup resulting in approximately -10% returns.
- Having a distribution at your disposal also enables us to draw more insights including std deviations and confidence intervals.
Final Comments —
- Dwayne ‘The Rock’ Johnson once said — “Success isn’t about greatness, it's about consistency.”
- Reaping benefits consistently in a volatile market requires a process that is robust, reproducible, and scalable.
- The goal of this blog is to equip the readers with tools that can help them set up strategies (NOT limited to MA crossover) that can reap benefits consistently by leveraging backtesting, data science, and Python.
- Wanna know how the MACD Cross-over Strategy Stacks up against this strategy?
Let's have a chat :
PS: I would love to collaborate on Toucan and add more features to it. Feel free to get in touch with me if you are interested in collaborating.


