
Are You Getting The Right Blood Pressure Diagnosis? Possibly Not
Non-medium members can read the full story here!
Hypertension is the most frequent diagnosis in everyday clinical practice. It can also be one of the most unreliable. That all depends on how your doctor arrives at his diagnosis and how he follows up on it.
That’s why I want to equip you with the necessary know-how to check whether your doctor’s diagnosis passes the sniff test of reliability. Because three scenarios are real and far from rare.
- Your doctor proclaims you hypertensive when you aren’t
- Your doctor proclaims you normotensive when he shouldn’t
- Your doctor misinterprets the effects of your blood pressure treatment
As a doctor of public health medicine with a focus on cardiovascular aging, more than two decades of research experience, and a particular interest in “forensic” data analysis, I have uncovered many instances of flawed data translation and interpretation. Blood pressure is no exception.
How reliable are hypertension diagnoses?
Blood pressure is highly variable, as it changes from one heartbeat to the next. This high variability has raised the question of how reliable the typical one-visit snapshots at your doctor’s office are.
Researchers from the Center for Outcomes Research and Evaluation at Yale New Haven Hospital and Yale University set out to answer this question [1]. They looked at the visit-to-visit variability (VVV) of 7.7 million blood pressure readings taken from more than 537,000 adults.
Then they zeroed in on the variability between consecutive blood pressure snapshots taken no longer than 90 days apart. There are two reasons for choosing this time window. First, it’s in most cases too short for the drivers of chronic blood pressure elevation to leave a noticeable impact. Second, it’s the typical time frame within which doctors reassess the effects of starting their patients on pharmacotherapy or of modifying it.
The statistics background
There is something you need to know before we continue: you can never know your true blood pressure. One reason is the beat-to-beat variability that I mentioned above. The other reason is the inevitable measurement inaccuracy that creeps into virtually every biomarker measurement. No matter how accurate your equipment is or how perfect your skill is.
These inaccuracies add up. In the case of systolic blood pressure (SBP), it is plus or minus 10 mmHg. In science terms, we refer to this as the standard deviation (SD). In a typical situation, that means two-thirds of the people with a measurement of, say, 125 mmHg will have their second measurement come in somewhere within the range of one SD, that is, between 115 and 135 mmHg. And one in three people will see a larger difference. We have to keep this in mind when judging our doctors’ blood pressure readings.
An illustrative example
So, let’s say you and 99 other people with “true” systolic pressure of 125 mmHg have your blood pressure measured at your doctor’s office.
Approximately 31 (one-third) of you will have a reading in excess of 130 mmHg, which is currently the defining threshold for hypertension (in the US; in Europe, we see it a little more relaxed, with 140 mmHg being considered the “red line).
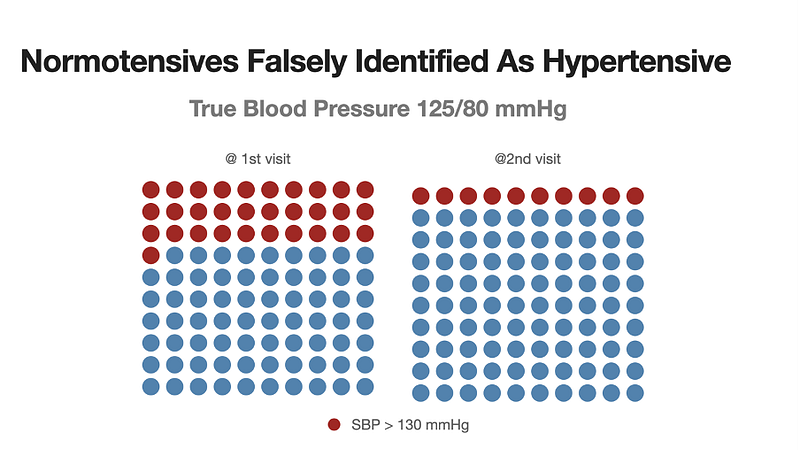
That is, you have an almost one-in-three chance of being suspected of having hypertension or pre-hypertension, even if your blood pressure is normal.
Now let’s further assume that these 31 people—whose true blood pressure is perfectly fine—will be invited by their doctor for a follow-up visit within 3 months. How many do you think will still have a reading above the “red line”?
Again, one-third of this falsely hypertensive cohort (see figure above). That is, ten people will have a second reading that puts them into the hypertensive, respectively pre-hypertensive range (depending on which side of the Atlantic you reside on).
So, here is the potential for 31 unnecessary follow-up consultations, 10 unjustified diagnoses of a chronic condition, and an epic proportion of needless worry and frustration. After all, one of every three U.S. adults between the ages of 20 and 40 has a systolic blood pressure between 120 and 130 mmHg [2].
That is all good news, not for you, but for the pharma industry.
How about blood pressure change?
In the following figure, every blue bar represents the blood pressure change for one of our 100 hypothetical patients.
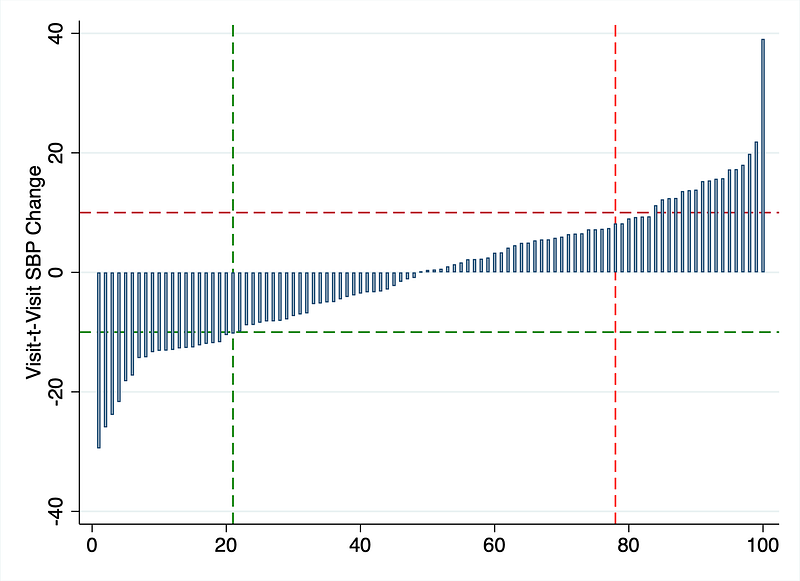
The horizontal dotted lines mark the 10 mmHg thresholds above which blood pressure changes are considered clinically relevant (red for +10 mmHg, green for — 10 mmHg). Even though there was no change in “true” blood pressure, 22 individuals saw a drop, and 21 saw an increase of 10 mmHg or more (the vertical dotted lines). With no true change at all, mind you.
If you suspect that the extreme differences of more than ± 10 mmHg affected those individuals whose baseline measurements were at the high and low ends of the spectrum, you are absolutely correct. This is a natural phenomenon that we call regression to the mean. We can observe it everywhere.
Sir Francis Galton detected that phenomenon in the late 1800s. And I am still fascinated by it today.
The figure below illustrates it. Again, every bar represents the SBP change of one of our hypothetical patients.
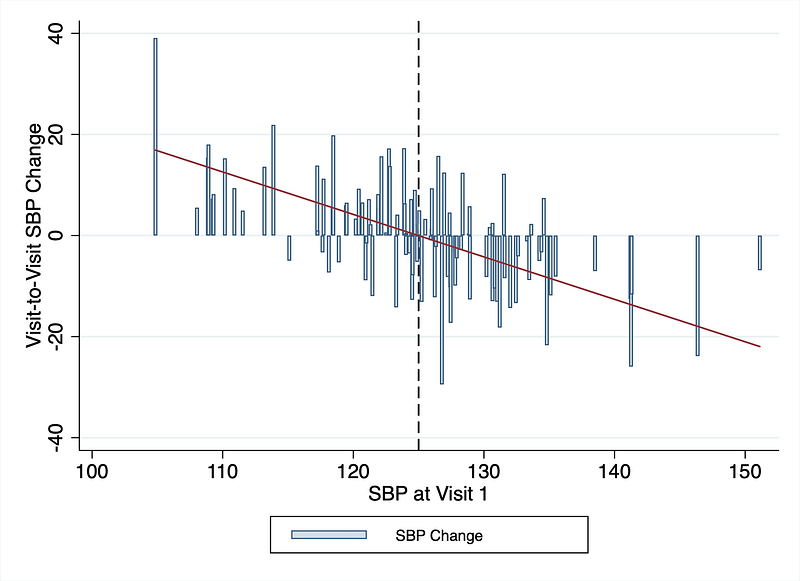
Despite having randomized the assignment of SBP changes, you can see that those with the lowest SBP at the first measurement (at the left half of the graph) saw the greatest increase in blood pressure, and vice versa.
The red trend line cuts through the zero-change point precisely at the center of the graph.
How reliably can office blood pressure measurements identify a drug’s effect?
Again, I ran a simulation using the VVV statistics that the researchers uncovered.
Let us assume that a blood pressure-lowering intervention will result in a true 10 mmHg drop in systolic blood pressure between the 2 visits.
The following figure illustrates the results.
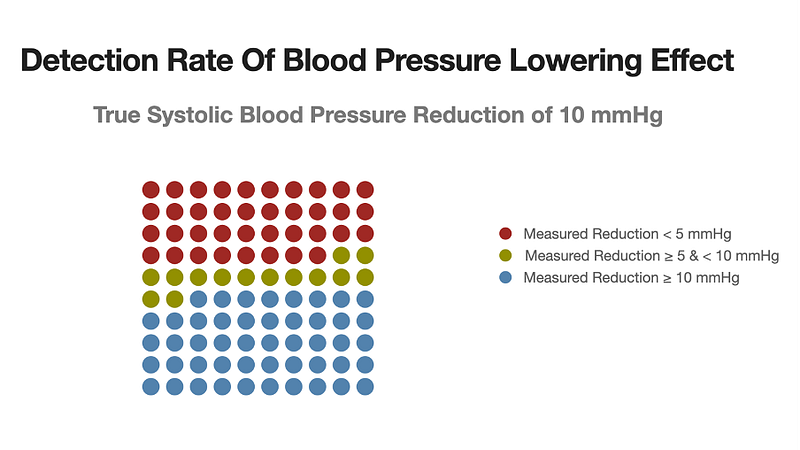
Fully 38% of the treated individuals will show a blood pressure reduction of less than 5 mmHg, or even an increase. 14 will show a reduction of between 5 and 10 mmHg, and the remaining 48 will show a reduction in excess of 10 mmHg.
The clinical relevance
First, a 5 mmHg drop is the accepted threshold for a clinically relevant change in blood pressure. That is, a change that meaningfully reduces the risk of major cardiovascular events.
Second, the roughly 60% of patients who show up with a clinically relevant blood pressure reduction is probably an optimistic figure because the simulated drop of 10 mmHg exceeds what is typically achievable with any single drug [3].
What does that mean for you?
For 4 out of 10 patients who have been prescribed an antihypertensive drug, the follow-up measurement of the drug’s effect will remain hidden.
The doctor’s knee-jerk reaction will probably be to either increase the dose or add another drug to the treatment combo.
What you should do
What should be the reaction in both of the scenarios that I described above?
Not to rely on office blood pressure measurements. Go and measure your blood pressure at home, repeatedly. Ideally, twice a day. At least that’s what I recommend to my clients. Keep a record and, if you have the means to, analyze the blood pressure trend.
I am not the only one saying this.
Hypertension societies around the world are warming up to the idea that regular and frequent home blood pressure monitoring (HBPM) is more informative than the occasional BP recording at the doctor’s office. That’s what the 2023 guidelines of the European Society of Hypertension tell us [4].
What You Can Do Today
One convenient way of doing HBPM is by using a self-inflating WIFI-capable device that has also been validated.
In my team, we are working with the Withings BPM Connect device, which directly communicates with our DIY lifestyle medicine platform.
My team and I have developed this platform to democratize access to individualized lifestyle medicine, making it accessible to lay users and their doctors. While we have focused our platform on monitoring pulse wave velocity and the rate of vascular aging, BP monitoring is a byproduct.
If that interests you, you can read more about it on our website.
Just so that you don’t get the wrong impression: I have no commercial links with the Withings company whatsoever. I do not receive any payments or other benefits from them.
Conclusion
I hope that this post has helped you to become a better judge of blood pressure measurement results and your hypertension diagnosis.
This post is not medical advice, it is simply information about the science and the data behind blood pressure measurement. I urge you to follow your doctor’s advice. Hopefully, you can ask him/her the right and pointed questions to which you, as the patient, deserve an answer.
References
[1] Lu Y, et al. Circ Cardiovasc Qual Outcomes 2023:305–15.
[2] Elfassy T, et al. Hypertension 2023;80:1452–62.