
Appending Tables in Power BI
Appending tables in Power BI is a crucial skill that can significantly enhance your data analysis capabilities. By combining multiple tables into a single cohesive dataset, you can streamline your workflow and ensure your analyses are comprehensive and accurate.
This article will guide you through the process, highlighting the key steps and benefits.
Here’s what we’ll cover:
Understanding Table Appending:
- Definition and importance of appending tables.
- Scenarios where appending is useful.
Step-by-Step Guide:
- Loading data into Power BI.
- Using the “Append Queries” function.
- Verifying the combined data.
Best Practices:
- Ensuring data consistency.
- Managing large datasets efficiently.
- Avoiding common pitfalls.
Things to Remember While Appending
- Column Names: Columns are combined by name, not order. Mismatched names won’t combine.
- Missing Columns: Columns missing from a table are left empty.
- Duplicate Values: Appending does not remove duplicates, similar to UNION ALL in SQL.
By the end of this article, you’ll have a clear understanding of how to append tables in Power BI, enabling you to handle more complex data analyses with ease.
Steps we would be following
We will go through these steps:
- Understanding the Table used
- Appending two tables
- Appending three tables
- Appending three combined tables with the Sales Combined table
Happy learning!

1. Understanding the Tables used:
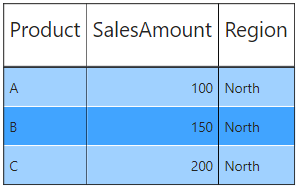
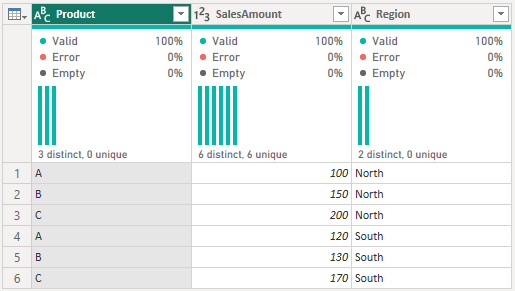
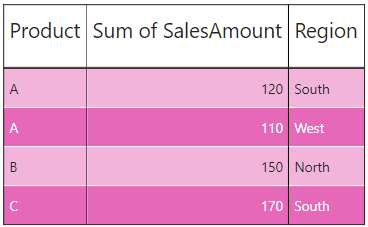
This table shows sales data for three products (A, B, and C) in the North region:
- Product: Identifies the item sold (A, B, C).
- SalesAmount: Indicates the total sales value for each product (100, 150, 200).
- Region: Specifies the area where the sales occurred (North).
Breakdown:
- Product A: SalesAmount is 100 in the North region.
- Product B: SalesAmount is 150 in the North region.
- Product C: SalesAmount is 200 in the North region.
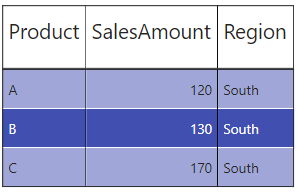
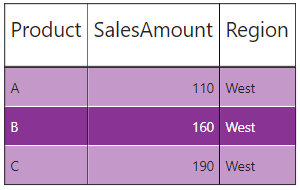
Similarly we have tables for SalesS and SalesW for Southern and Western regions respectively.
2. Appending two tables:
- Click on Transform data from Queries.
- This will open Power Query.
- With SalesN table selected press on Append Queries from Combine.
- In Append Pop up Table to append select SalesS and press OK.
- We will get our Appended table.
Note — You can append any one of table of the three with any other.
3. Appending three tables:
- With SalesN table selected press on Append Queries from Combine.
- In Append Pop up Table to append select Three or more tables.
- Select SalesS and press on Add then select SalesW and press on Add again.
4. Appending three combined tables with the Sales Combined table:
The Sales Combined table contains records from SalesN, SalesS and SalesW.
- With the combined table created in previous step selected press on Append Queries from Combine.
- In Append Pop up Table to append select Three or more tables.
- Select Sales_Combined and press on Add and press OK.
This table contains redundant data
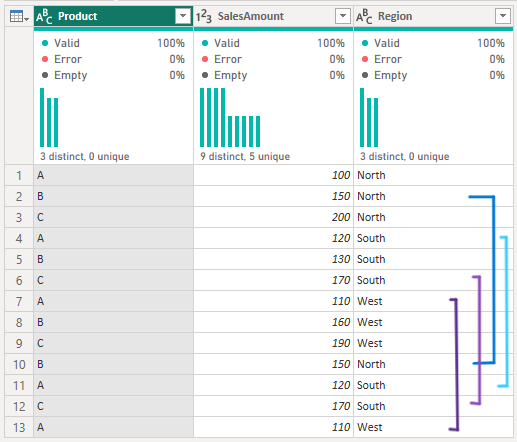
As you can see some of the data in this table is redundant.
Download data for this article from this link.
Thank you for your attention!
Follow me or subscribe to get all my Power BI articles!
Don’t forget to subscribe to
👉 Power BI Publication
👉 Power BI Newsletter
and join our Power BI community:


