
A Simple Way to Scan for Breakout Candidates Using Python
And save on valuable time searching for trading opportunities!

After discovering the Swedish swing trader Qullamaggie, I became very interested in finding algorithmic ways to implement his swing-trading breakout strategy. Since I work a full-time job, any way to use algorithms and save on valuable time is greatly appreciated!
Here is the result from a rather simple scanner I programmed, applied to the textbook breakouts from the Tesla stock (TSLA) between 2020–2021; the green areas are the regions my python code identified as consolidation periods before a potential breakout.
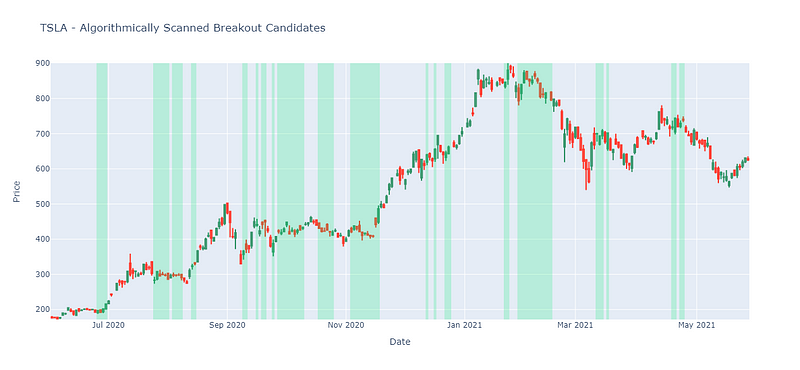
You can see that some of the green areas are regions before a big move in the stock price! Some are false signals of course, no method is perfect after all. However, this helps me filter down 1000’s of stocks to the interesting few much faster than I can do by hand!
In this article I will go through:
- Roughly what we are looking for in Qullamaggie’s breakout strategy.
- How to implement a simple yet effective scanner in Python for the breakout strategy.
- Ideas for more sophisticated scanners with better accuracy.
All code will be included in this article 🙂
The Breakout Strategy Scanner
Simply put, the breakout strategy requires that we have a stock which fits the following criteria:
- It has grown significantly over a 1 month, 3 month, or 6 month period. Typically > 30% growth.
- After this growth, the stock must have an orderly pullback or consolidation phase for a few days to a few weeks (i.e. trading sideward).
The stock may undergo a tightening range, or exhibit a “flag” pattern; you can see this on the TSLA breakout chart below where the support and resistance trend lines converge:
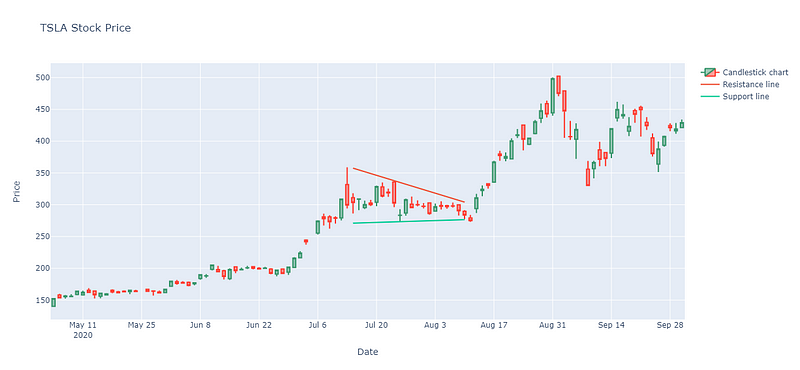
By the way, these trend lines were drawn using another algorithmic approach I developed. You can learn about this in another post I have written:
There are a variety of nuances with this technical analysis setup, but those are the key points. For those who are interested in further learning about this approach, I highly recommend checking out Qullamaggie’s guide.
The Python Implementation
We want to algorithmically scan for high-growth, and sideways price action. The growth portion of the scanner is easy with a little pandas knowhow!
The above code will download the latest TSLA data from yfinance (you may need to pip-install this package), and place a new column into the dataframe called “trend_filter”, which is a binary column (1 = fits growth criteria). You can filter for the dates where the growth criteria is met by using the following one-liner:
df_trending = df[df['trend_filter'] == 1] % Easy stuff!The growth filter is implemented as the percentage change between the day you are considering, and the minimum within an x day window (where x = 20, 60 and 120 in the code). I have used 25% for the 1 month scanner, 50% for the 3 month scanner, and 80% for the 6 month scanner — feel free to adjust to let in more/fewer results.
⚠️ Note: The trend filter is an OR criteria, meaning we get a classification = 1 if any of the growth criteria are met; not just all simultaneously.
Sweet, how about the consolidation part?
Well… this is a little trickier, but nothing we can’t handle! Arguably, the simplest way to check algorithmically is to see if the stock is trading within a fixed percentage window; in other words, if the price today is within x% of y days ago, then it’s likely going sideward (if x is small, of course).
But financial market data is inherently noisy, and we could miss out on valuable data points for really noisy data with a small x. So how do we avoid this problem? The answer: time series smoothening!
In essence, if we smoothen out the time-series like the GIF below, then finding if the stock is trading within a range becomes more stable.
Note, the above GIF is from another medium article I wrote which describes the nitty gritty behind a time-series smoothening approach I developed.
The code which implements the smoothening and finds if a stock is trading with an x% range can be found below:
⚠️Note: I have placed some example hyperparameters as default function inputs, these can be changed if you find a better combination of them (and do let me know if you find better parameters!). These are as follows:
- Time-series days to smoothen = 50 days
- How many days back to percentage check = 5 (i.e. percentage change of the recent day to 5 days ago, to see if it’s rangebound).
- The threshold % to define a rangebound data-point = 1.5%
- The number of days to check for consolidation = 5 (we say a data-point is consolidating if any of the last 5 days are classed as consolidating, this helps smoothen the scanner’s results further).
With all functions in the same file, you can find the consolidating regions using:
df = yf.download('TSLA').reset_index()
df.loc[:, 'consolidating'] = find_consolidation(df['Close'].values)
df.loc[:, 'trend_filter'] = trend_filter(df['Close'])
df.loc[:, 'filtered'] = np.where(
    df['consolidating'] + df['trend_filter'] == 2,
    True,
    False,
)
Therefore, the “filtered” column indicates any place where we have consolidation and it meets the growth criteria.
If you’d like to plot the result, you can place this code after the logic used to find the filtered column (as shown above), please note that I filter to plot within a specified date range (on line 5).
Remember to import the packages required for both of the codes 🙂
A More Sophisticated Approach
Whilst the scanner shown here is simple and effective, it will generate some false signals, or even miss some interesting breakout candidates because the data could be quite noisy.
To improve upon this approach, I used the scanner on a set of stocks to identify potential consolidation/breakout patterns, and then hand-classified around 20,000 points as true or false (it was rather painful to do this, I will admit…). With this classified data, I trained an pattern-recognition LSTM neural network with the aim of outperforming the simple scanner; no growth filter required!
Here is the comparison between the simple scanner, and the more advanced neural network on the earlier presented TSLA chart:
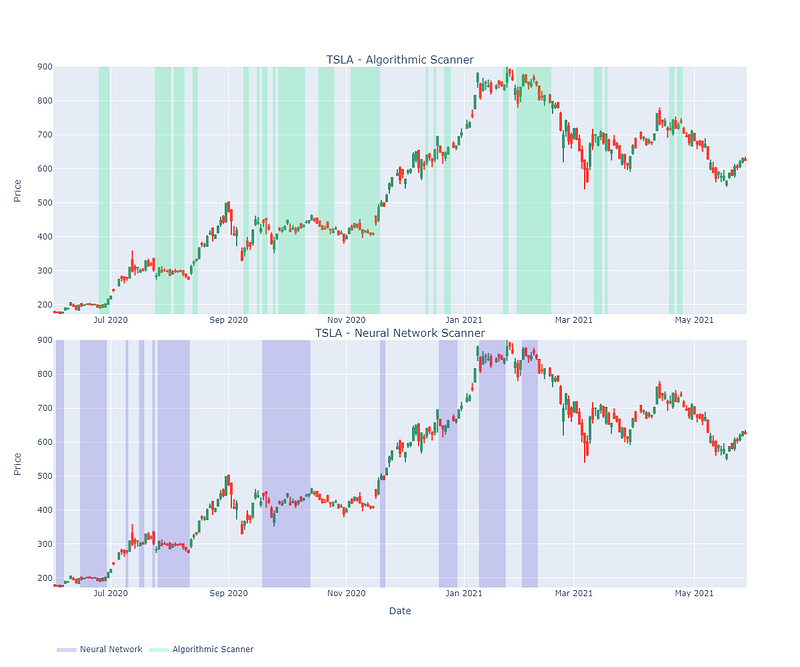
In my opinion, I feel like the LSTM scanner does a good job at eliminating any false-signals the simple scanner may generate (see the right-side of the charts). In training/testing, it was ~92% accurate. To further enhance this, I have to muster up the motivation to sit and label more data…
The starting steps I took to train such a network can be found in this article:
EDIT: This article was originally posted on Medium, but has now been moved over to my personal website where it will be maintained into the future.
Thank you for reading, I hope you enjoyed the article! Please feel free to connect with me on LinkedIn — I’d love to hear from you! Also feel free to follow/DM me on twitter.
If you are thinking getting a medium account, then please consider supporting me and thousands of other writers by singing up for a membership. For full disclosure, singing up through this link grants me a portion of your membership fee, at no additional cost to you (a win-win for sure!).
Or if you’d like another way to support my content creation, then you could

Because I work a full-time job, go to the gym, trade, and write on Medium, I use a lot of coffee!


