
A Complete Introduction To Time Series Analysis (with R):: Introduction
Let’s first consider this pretty graph below
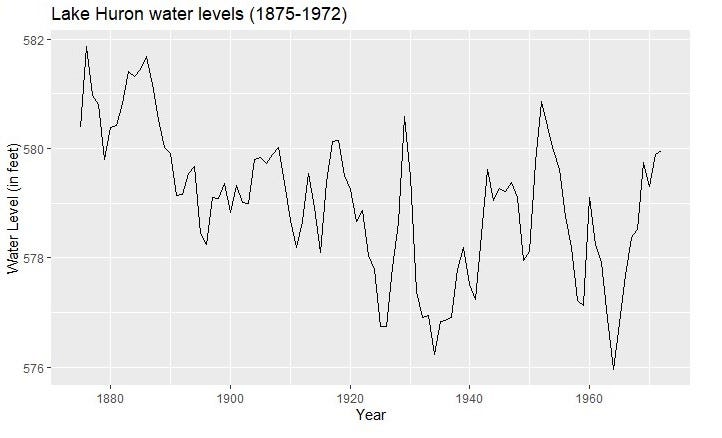
What can you see? Well… If I were you, not much, really. Perhaps you might see that overall the points seem to decrease over time. You might also notice that there is a bunch of peaks here and there. But what do these even mean?
So let’s first consider this question instead: What are the main ideas/goals of time series analysis?
- Compute trends and variability
- Compute season of variation, based on some periodic behaviour.
“But wait, you haven’t told me what any of these mean?” Very simply put, trend is the “tendency” of the data over time (increasing, decreasing); season indicates some degree of repetition each certain period of time. We will come back to these in later articles.
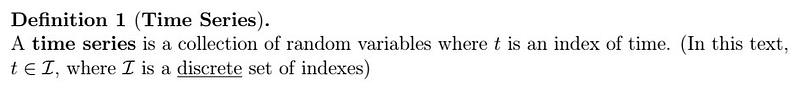
Now, let’s consider the formal definition of a time series:
Working with Time Series
Generally speaking, we would like to follow the following approach:
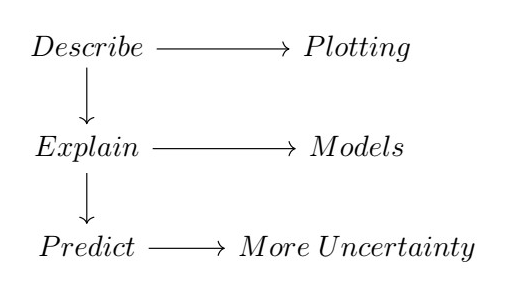
Describe: - Talk about trends and volatility - Come up with a concise summary of the volatility, but still explain the underlying data Explain: - Come up with models that could adequately explain the underlying data. - Need probability models - We need to make some untestable assumptions Predict: - Once some adequate model has been chosen, test the model on new data.
Ok, ok, but then, how much dependence should we consider in our model?
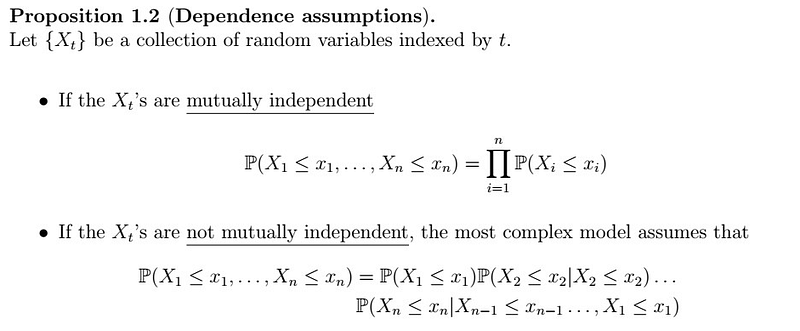
Certainly assuming that all our observations are independent does not help much. On the other hand, if we assume too much dependence, our model becomes too complex to manage or interpret.
Our goal: something in between, i.e. not too much independence, but we seek to have just the necessary dependence to reasonably explain the data. We will see what this means in later articles.
How to R
In the code above we first load the forecast library in line 2; this contains a lot of useful functions that we will use later. One of them is the autoplotfunction, which is actually based on the gg-plot package to output beautiful visualizations.
You can inspect the LakeHuron object using the function class , which tells us this is a time series. The function str also provides information into the object, telling us this time series has 98 values, from 1875 to 1972.
The third part of the code (on lines 9–11), is what produced the graph at the beginning of the article; autoplot will essentially do the job for you, ylab stands for vertical labeling, and you can probably guess what ggtitle does.


