
5 must know Excel functions and why you should learn them
Every Data professional at some point needs to use Excel, many will be comfortable with other tools (PowerBI, Alteryx) and languages (SQL, Python) but Excel remains the backbone for many businesses, it is also the most widely adopted data tool in the world today. Knowing key functions and features in Excel will really make a difference in how quick you can produce a piece of insight or analysis, often when you have unknown data sets to work with.
These are my top 5 excel functions and why they are important:
The Data file for each function can be accessed below:
1. VLOOKUP
Many regard VLOOKUPs as the “Bread and Butter” of Excel. It is your quintessential function for joining data. It is the equivalent of a LEFT JOIN in SQL. By using a VLOOKUP you can quickly “connect” pieces of data together to build deeper insight and analysis. VLOOKUPs can be used to add on additional data points sat in other CSV or excel files.
The other big trick which many people don’t know about VLOOKUP is that it can be used to calculate ranges. The below example uses a VLOOKUP to identify a range of values instead of using an Exact Match, we use an Approximate Match.
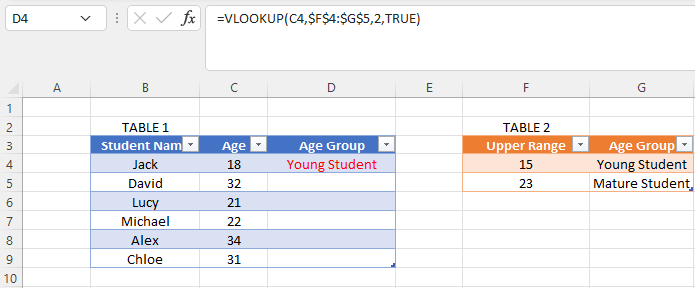
In Table 1, we can see we need the Age Group for each student, the Age Group range is provided in Table 2, we use a VLOOKUP formula to automatically populate Column D in Table 1 simply by adding TRUE to the end of our VLOOKUP to invoke the Approximate Match.
The last mention is that there are alternative methods to using VLOOKUP, including the INDEX MATCH method, but it is worth mastering VLOOKUP first as a good initial step.
2. SUMIFS and COUNTIFS
Using these two functions can really make life a lot easier when you need to filter data by particular values without needing to structure your data first. It can be used to quickly put together a Self-Serve report for stakeholders which they can analyse. This is something I learned late in my career from one of my previous managers at HSBC bank who was a Master at using SUMIFS and COUNTIFS.
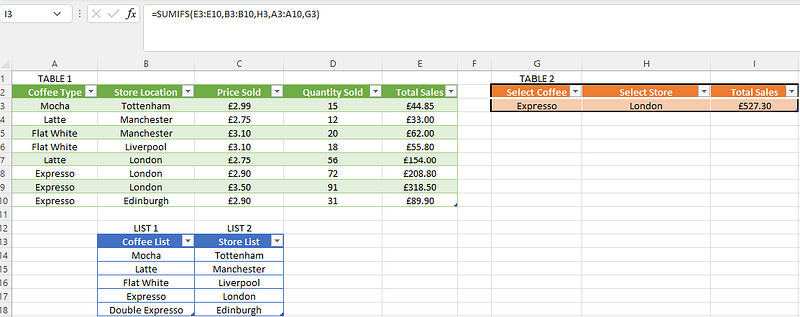
In the below example we can use a SUMIFS formula to calculate the total sales of Coffee by a particular city in Table 1. Our drop-down lists in Table 2 allow users to select the Coffee type or City name to get the total value of Sales in cell I3 using a SUMIFS formula. The values in our Drop Down lists are held in both List 1 and List 2.
3. Tables and Pivot Tables
It is important to structure data when you are using Excel, if you have a block of data, it is best you structure them into a Table (Insert > Table) that way Excel knows it is a group of data and you can easily add or delete from the Table as you need.
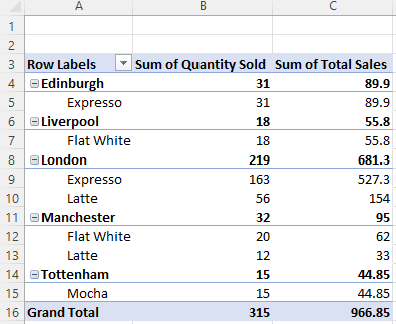
Tables are also a prerequisite to Pivot Tables (to me Pivot Tables are the heart of Excel), they are a brilliant way of aggregating data to analyse it further
Using our Coffee data, once put into a Table we can then insert into a Pivot table (Insert > Pivot Table) this then allows us to “Pivot” our data into any shape we want:
4. Pivot Charts and Slicers
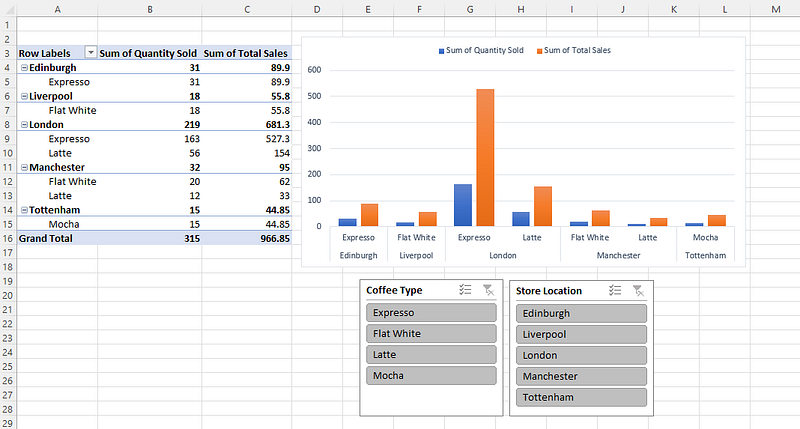
Once you have a Pivot table you can then add some further magic touches using Slicers (Insert > Slicer ) and or Pivot Charts (Insert > Pivot Chart), these bring to life your Pivot Table and similar to Point 2, they offer another way of analysing your data, again you can use Pivot Charts, Tables and Slicers to share files with clients or colleagues so they can self-serve.
Using our Pivot table created earlier we can now add some really nice visuals using a Pivot Chart, our Pivot Slicers allow users to filter the data by City or Coffee type:
5. IF formulas
An IF formula is a classic computer statement, it literally says IF a condition is THIS then give me THAT, it is present in just about every major coding language and Data tool in some form or shape. In Excel, it is written as a simple =IF followed by your condition or logic. IF formulas as great to use because they allow you to perform an action only if certain conditions are True or False, they allow you to produce more detailed insight when using Excel tables or data.
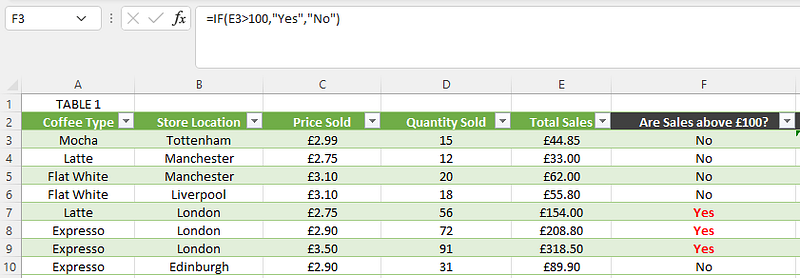
In the below table in Column F, we only want to see a YES if Total Sales are above £100. The formula for this is given in the formula bar below
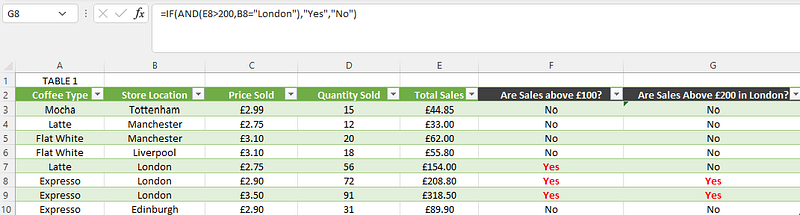
But say we want to apply this to 2 conditions, Both >£200 and only sales in London, well we can do this with an IF AND formula:
IF formulas can be simple with single conditions or have many conditions in the form of Nested IF formulas. They are definitely worthwhile learning
Conclusion
Excel will continue to be a widely used tool in the world of Data Science and Analytics for many years to come. Even with the rise of Cloud Computing and Python, Excel remains a key tool used by practically every business.
Please follow me for more articles on Excel, Python and Business
Check out some recent articles I posted below: