
Diagram Explained: The Supportance Model and Its History
A new diagram for the concept of Supportance
Last week, I worked on the above Miro board in order to review the historical development of a diagram and designed a new version of the diagram.
The diagram was born on Feb 6, 2021, when I was rethinking the Platform-for-Development (P4D) framework (v1.0) with the concept of Supportance. The framework (v1.0) suggested a new unit of analysis: Platform(Project). I remained in the unit of analysis and used supportive movements as a core idea to design a diagram. I called the final outcome the Supportive Cycle model.
In the past several months, I modified the diagram and designed several new diagrams for different concepts and models. Last week, I realized this is a great example of Diagram Development. Thus, I created the above Miro board to review the process of my creative activities around the diagram. I also designed a new diagram for the concept of Supportance.
Three Turning Points
The reflection shows three turning points within the developmental process of the project.
- Feb 6, 2021: Turning Point A
- April 22, 2021: Turning Point B
- June 6, 2021: Turning Point C
Turning Point A is the beginning of the journey. I have mentioned it above. You can find more details from a previous article The Supportive Cycle (v1.0). The article inspired me to write more articles on deep issues. Eventually, it became a book: Platform for Development.
Turning Point B is about the BACK TO W.E.C. project. On March 26, 2021, a friend invited me to join the BACK TO W.E.C. project, a two-month online workshop for re-engaging with The Last Whole Earth Catalog. This is a great example of the Platform-for-Development framework. On April 7, I designed a diagram for this case study.
The project is hosted on Milanote and other platforms. I created a sub-board called Curativity and shared some files about Knowledge Curation. In order to share more ideas about the HERO U framework which is a framework for Knowledge Curation, I wrote a new file about the framework. Later, I expanded it to a 311-page book: The ECHO Way.
I finished the draft of The ECHO Way on April 19, 2021. Two days later, I wrote a thank-you letter to the hosts of the project. On April 22, I reflected on my work on The ECHO Way. I realized that the Supportive Cycle model can’t explain the work. Finally, I found a new solution that the work could be considered as a “sub-project” of the BACK TO W.E.C. project. Moreover, I used “sub-project” and “project-camp” to replace “project” and “platform-ba” in order to reuse the diagram of the Supportive Cycle model.
Turning Point C is about reflecting on Turning Point B. On June 16, 2021, I received an email from a host of the BACK TO W.E.C. project. Her email inspired me to reflect on the diagram of the Supportive Cycle model. I realized that there is a need to design a diagram for the concept of Supportance in general. Finally, I used “Actor — Group” and “Container — Context” for the new diagram.
Five layers of Diagramming
In 2018, I wrote a 108-page personal thesis titled Diagram Explained. I developed a framework for understanding multiple layers of diagrams.
- Layer 1: Schema of spatial relationships
- Layer 2: Models of domain cognition
- Layer 3: Application of models
- Layer 4: Artifact of epistemic tool
- Layer 5: Mediation of human activities
In order to help readers understand my creations. I used five types of diagrams for this case study.
- Layer 1: Meta-diagram
- Layer 2: Diagrams for Theories, Diagrams for Abstract Models, and Diagrams for Concrete Models.
- Layer 3: Diagrams for Case Studies
Layer 4 refers to the Artifact of the epistemic tool. For example, the Developmental Project Canvas is a Layer 4 artifact for the Developmental Project Model which refers to a Layer 2 diagram.
Layer 5 refers to diagram-in-use situations such as a workshop.
Five diagrams
Let’s have a look at the five diagrams.
Meta-diagram
A meta-diagram only represents a special spatial relationship without any concept. See the below diagram.
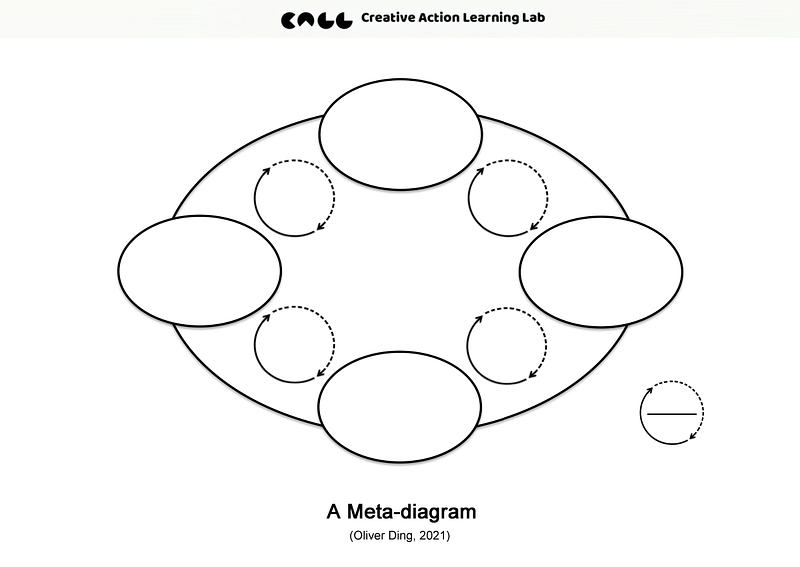
A meta-diagram defines a basic visual identity of a diagram family. By adopting a meta-diagram, people can easily create domain-based models without inventing a new wheel for thinking about spatial relationships.
Diagrams for Theories
Supportance is a brand-new theoretical concept. In fact, it is a sub-theory of the Ecological Practice approach. The diagram below doesn’t talk about Affordances. Thus, it is only for the concept of Supportance.
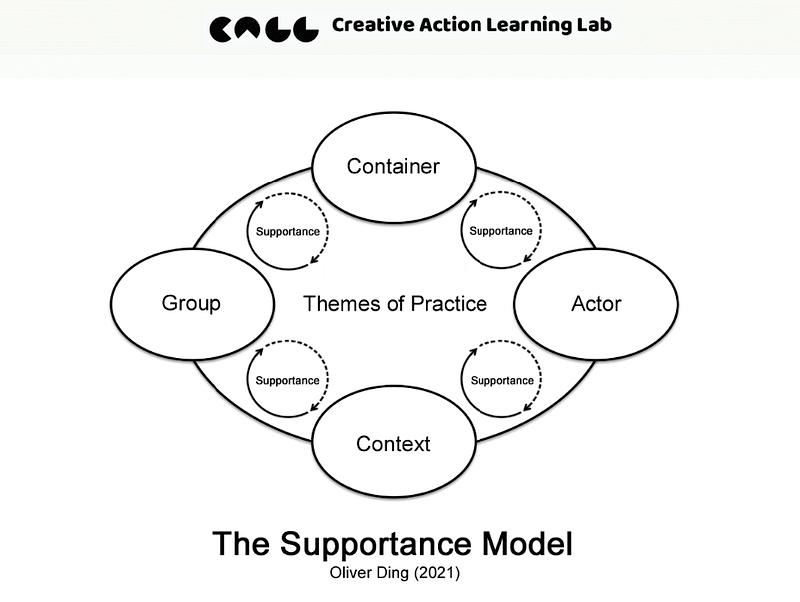
The term “Container” is the core concept of the Ecological Practice practice.
Diagrams for Abstract Models
Infoniche is defined as a set of Affordances and Supportances. So, the concept of Infoniche is an intermediate concept. The Infoniche framework aims to present a structure for discussing Affordances and Supportances within various types of environments.
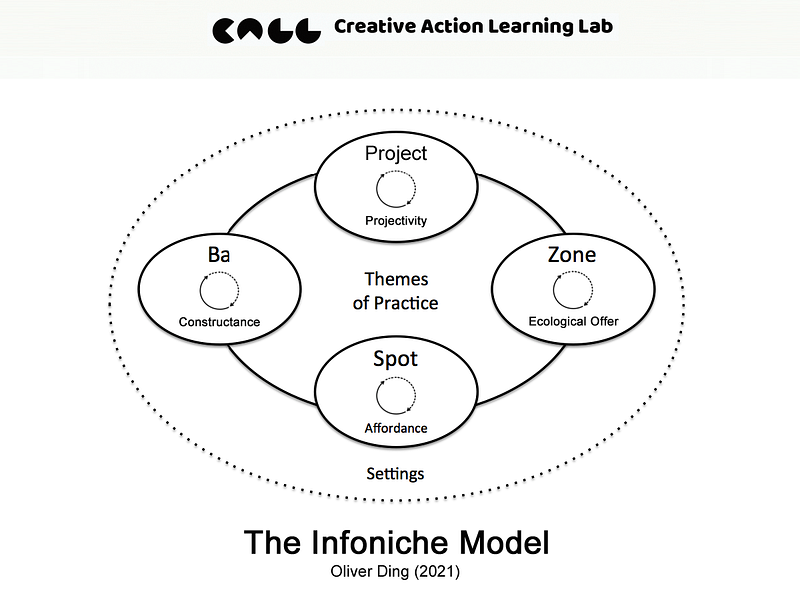
As an intermediate framework, the Infoniche model considers several concepts such as Affordances, Supportances, Zone, Project, Ba, etc. The goal of the model is for building a bridge between Theory and Practice.
Diagrams for Concrete Models
The Supportive Cycle model is a sub-framework of the Platform-for-Development framework. It focuses on a special unit of analysis: Platform(Project).
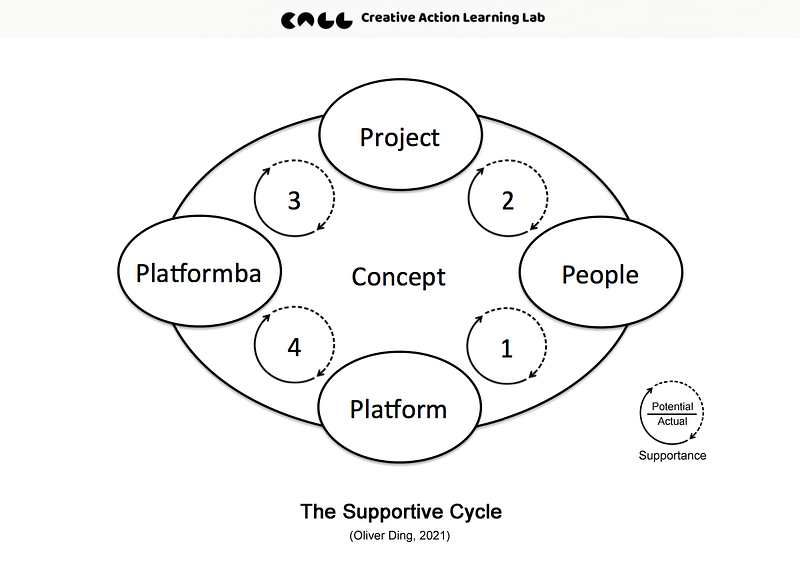
A practical framework aims to offer tools for empirical research and self-study. In order to simplify the task, I removed “Zone” from the model since “Zone” is about intersubjectivity and interpersonal analysis. Also, I have developed a diagram for “Zone” too.
Diagrams for Case Studies
The diagram below is a case study of the Supportive Cycle model.
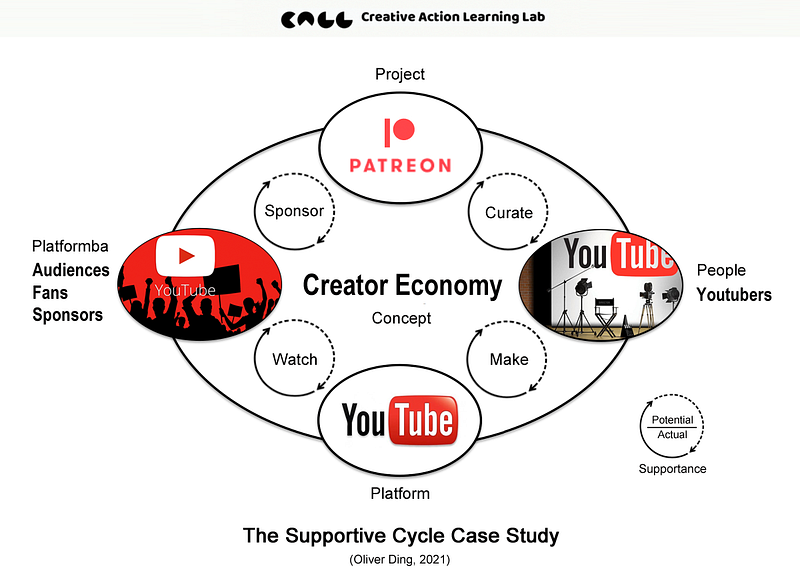
I have mentioned two ways of conducting case studies of Supportive Cycle model:
- Rapid Analysis
- Slow Synthesis
Rapid Analysis is based on a very limited number of observations and its report might be just a blog post while Slow Synthesis is based on formal qualitative research methods such as participatory research and other methods. The report of Slow Synthesis might be a white paper or a book.
You can find a Rapid Analysis example here:
Diagrams are a tool for visually representing complex relationships. A brand new diagram offers a new way to connect a new theory and practice.
Further Reading
If you want to know more details about the Platform-for-Development (P4D) framework, you can start with this summary:
I am also working on editing a book for the framework. Here are the contents of the book:
Thank you very much!
You are most welcome to connect via the following social platforms:
Twitter: https://twitter.com/oliverding Boardle: https://www.boardle.io/users/oliver-ding Doowit: https://doowit.co/profile/gm0k2ax9 Linkedin: https://www.linkedin.com/in/oliverding
License
This work is licensed under the Creative Commons Attribution-NonCommercial-ShareAlike 4.0 International (CC BY-NC-SA 4.0) License. Please click on the link for details.


