
2023 Shatters Climate Records, But Where’s the 1.5°C Limit?
The Planet is Burning Behind the Hypocrisy of the 1.5°C Curtain
“We need to show that the international community can deliver and send a clear signal that keeps 1.5°C within reach.” COP28 President Sultan Al Jaber, October 30, 2023.
Before 1.5°C, there was 2°C. In 1995, the Intergovernmental Panel on Climate Change released a report projecting a 2.5°C warming with a doubling of carbon dioxide. Twenty years later, in 2015’s Paris Agreement, some 200 countries agreed to limit warming to 1.5°C.
There was just one problem. Very few policymakers or the general public truly understood what a 1.5°C means, the timeline and conditions for reaching it, and the distinctions between various warming scenarios. Seeking clarity, the Paris Agreement parties turned to the IPCC.
The resulting report from October 2018 outlined the stakes of an additional one and a half degrees of warming for the first time. While 1.5°C was not deemed “safe,” it was certainly better than the alternative of 2 degrees. And so, 1.5°C became a rallying cry for diverse groups, from Greta to developing nations, all underscoring the urgent need for immediate climate action.
But incomprehensibly, the Paris Agreement lacks a formally agreed-upon way to define the present level of global warming. It doesn’t even explicitly and unambiguously define ‘temperature increase.’ Without a consensus metric, determining when the 1.5°C level has been reached becomes challenging, potentially causing distractions and delays precisely when climate action is most urgent.
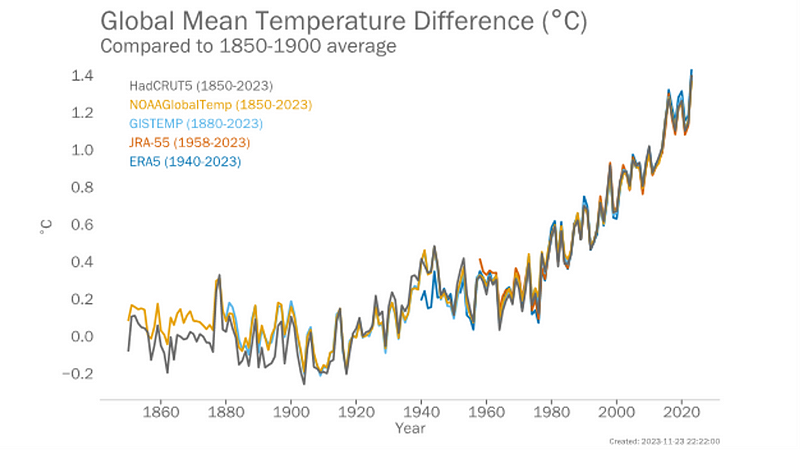
Since Sultan Al Jaber’s words above, diplomats and policymakers from US Climate Envoy John Kerry to the European Parliament have repeated the same refrain. Yet all their appeals belie an uncomfortable truth: the estimated temperature increase in 2023 concerning pre-industrial conditions across datasets span from 1.29°C (NOAA) and 1.35°C (NASA) to 1.46°C (Copernicus) and 1.53°C (Berkeley Earth). The choice of data and the methodology for filling gaps between observations influenced the resultant temperature figures.
Technically speaking, 1.5°C isn’t dead yet. But one thing is clear: 2023 will be the hottest year on record and one very close to breaching the 1.5°C threshold determined in the Paris Agreement and triggering all cascading tipping points of no return.
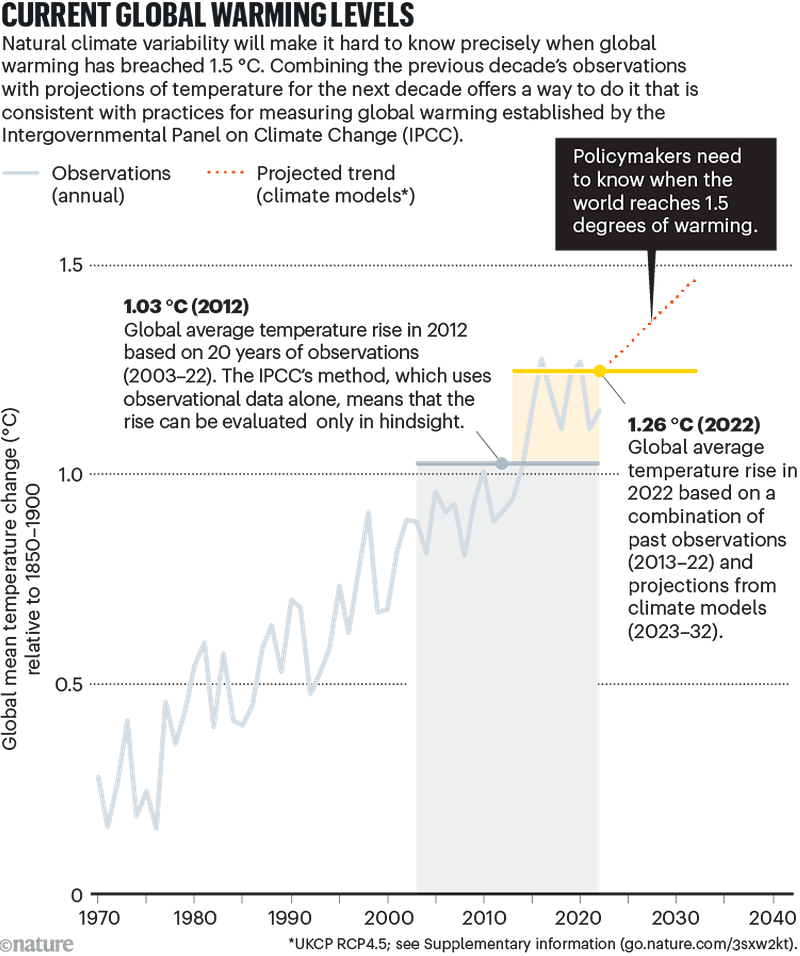
The world now needs a global consensus on where that 1.5°C threshold truly stands. First, it is important to understand that surpassing the 1.5°C threshold in a single year is not equivalent to a breach of the 1.5C warming limit in the Paris Agreement, which refers to “long-term human-induced warming”, excluding annual temperature fluctuations.
A significant concern raised by skeptics is the irregular increase in global temperatures. The natural ups and downs, influenced by events like El Niño and volcanic activity, overlay the long-term human-induced warming trend. For instance, global mean temperature briefly spiked by 1.5°C or more in 2016, 2017, 2019, 2020, and 2023.
As per the Paris Agreement, these brief warm spells don’t qualify as breaching the 1.5°C limit, and even a scorching year like 2023 doesn’t trigger a breach. The World Meteorological Organization (WMO) anticipates a 66% chance that global mean temperature will exceed 1.5°C for at least one year in the next five years, but this is likely to be a temporary anomaly.
The past nine years, from 2015 to 2023, ranked as the warmest on record. The emergence of a warming El Niño event in 2023, expected to peak in 2024, contributes to this trend.
So, how do we determine if we’ve crossed the crucial 1.5°C mark?
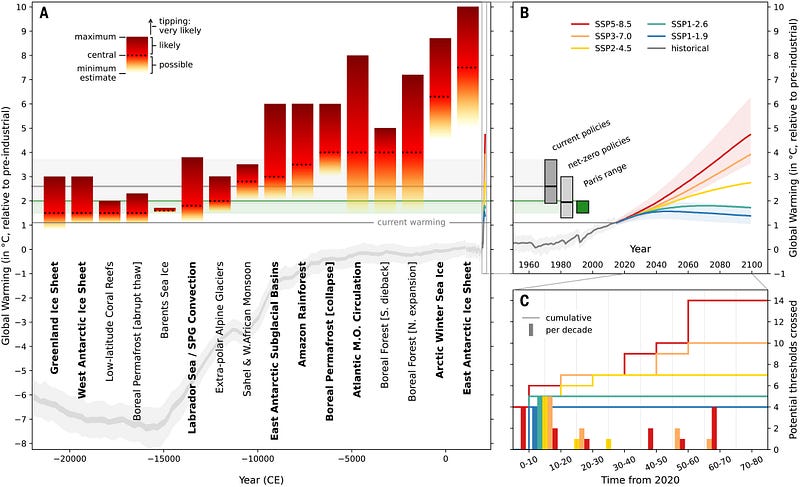
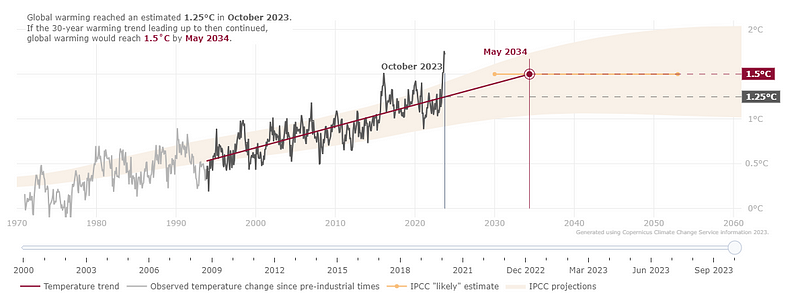
The latest IPCC assessment report, AR6, defines the 1.5°C mark and other global warming levels in terms of projected 20-year averages relative to the average for 1850–1900. According to this definition, 1.5°C of warming would be confirmed a decade after crossing the threshold.
If the current warming trajectory persists, IPCC projections suggest that 1.5°C will be breached around 2030, give or take a decade, with formal recognition occurring around 2040 based on 20-year averages. Seriously???
We need an urgent consensus to establish a prompt metric for determining the current level of global warming. Millions of lives are at stake here. Once defined, this metric should be formally adopted within the Paris Agreement framework, aligning with established IPCC practices and enabling swift recognition of the 1.5°C threshold.
Several such methods are already in use. It is mandatory to reduce delays. Because this period will be marked by a series of crossroads. And many of those are already piling up.
1.5 °C In Real Life
Starting in March, conditions in the tropical Pacific began to transition rapidly into what is shaping up to be a strong El Niño event. Since then, a pattern of monthly temperature records has become the trend. On August 20, 2023, temperatures at the North Pole stayed above zero for more than a day, indicating that the latent heat tipping point was reached and that sea ice melting could not consume more heat. September was the warmest month ever recorded, and every temperature dataset converges on a shared prognosis: 2023 will be the hottest year on record.
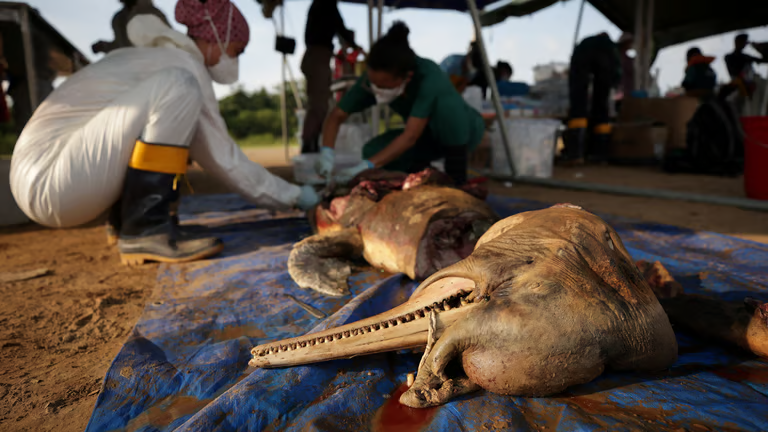
Extreme heat affected pretty much every corner of the world, including my hometown in Patagonia, Argentina. Heat affects health and is linked to increased morbidity and mortality. To name one, a heatwave in Mexico during June and July killed at least 167 people. And obviously, it’s not only humans affected: more than 100 river dolphins died in the Amazon in late September as the level of the river fell by 30cm each day for two weeks.
Unprecedented doesn’t even begin to describe Canada’s wildfire season, with the total area burned nationally reaching 18.5 million hectares, more than six times the 10-year average. The deadliest single wildfire of the year occurred in Maui, Hawaii, claiming at least 99 lives — the deadliest wildfire in the USA in over a century.
OCEANS
The oceans have become a battleground of extreme temperatures, shattering records day after day. In particular, July, August, and September broke records by a significant margin, ranging from 0.21 to 0.27°C. And climate change has caused them to be simultaneously warming, acidifying, and losing oxygen.
→ Ocean Heatwaves
This year alone, the ocean in Florida reached over 100 °F. Heatwaves start with changes in wind and ocean currents. Weakened winds lead to temperature increases as warm surface water remains stagnant while colder water fails to rise from more profound levels.
Ecosystems and complex species like animals and plants have a sweet spot for temperatures. Warming throws them off balance, causing shifts in where they live or even massive deaths because they can’t handle the extremes.
And warmer waters create favorable conditions for the swift formation and intensification of storms. Every 1°C increase in ocean temperature increases a hurricane’s “destructive potential” by 50%. Hurricane Otis, initially forecasted as a tropical storm, hit Acapulco with, the most powerful hurricane ever to strike Mexico.
→ Ocean Acidification
The oceans absorb about 20–30% of CO₂ emissions. But as the atmosphere gets packed with more CO₂, the ocean’s capacity to soak it up weakens. And this CO₂ doesn’t just stay put; acidity has surged about 30 percent.
→ Ocean Deoxygenation
The Global Ocean Oxygen Network reports that since the 1960s, the area of low-oxygen water in the open ocean has increased by 4.4 million square kilometers. That’s almost two times the size of my country, Argentina, the 8th largest in the world. This means fish need to consume more oxygen and need to consume more energy to survive.
→ Sea Level Rise
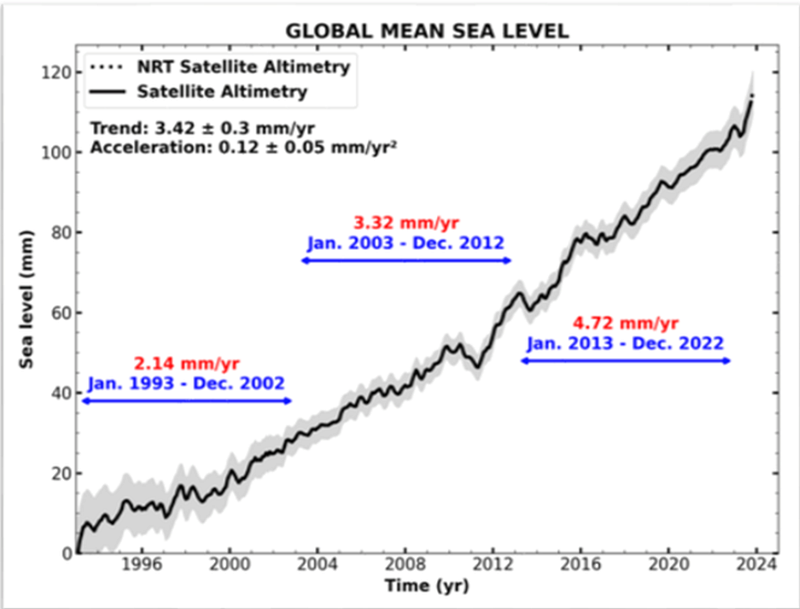
The rate of sea level rise observed from 2013 to 2022 is more than double the rate recorded for 1993–2002 and reached a record high this year. The accelerated rise is attributed to ongoing ocean warming, melting glaciers, and ice sheets, adding to the blend of environmental factors that cause massive floods and stronger hurricanes.
→ Extreme rainfall
Mediterranean Cyclone Daniel had a devastating outcome in Libya in September, in part caused by a warming ocean combined with increased evaporation. Five consecutive seasons of drought in the Greater Horn of Africa also reduced the capacity of the soil to absorb water and were followed by floods, triggering even more displacements.
→ Cryosphere
This year, notable changes occurred in the Earth’s cryosphere, particularly in Antarctica, where a new study found that the white continent is warming nearly twice as fast as the global average, surpassing IPCC estimates. In February, Antarctic sea ice reached a historic low, breaking the previous year’s record. The September sea ice maximum failed to exceed 17 million square kilometers for the first time, roughly 1.5 million km2 below the 1991–2020 average and 1 million km2 below the previous record low maximum from 1986. This affects the delicate balance of the ice-albedo feedback, which hinders ice regrowth. Like this, Antarctica’s contribution to global sea-level rise has tripled in the past decade, posing a severe threat to coastal communities and low-lying islands. And the deep Antarctic ocean current is slowing down due to meltwater, with potential acceleration in the coming decades.
In the Arctic, sea ice marked its fifth and sixth lowest annual maximum and minimum extents. On August 20, temperatures at the North Pole remained above zero for over a day, indicating a tipping point where sea ice can no longer absorb additional heat.
Glaciers from North America, the Himalayas, Europe, and Patagonia once again suffered an extreme melt season, with Swiss glaciers losing about 10% of their remaining volume in the past two years.
The One Reason for The 1.5 °C Crisis
“Greenhouse gas levels are record high. Global temperatures are record high. Sea level rise is record high. Antarctic sea ice is record low. It’s a deafening cacophony of broken records.” WMO Secretary-General Prof. Petteri Taalas, November 2023.
Greenhouse Gases
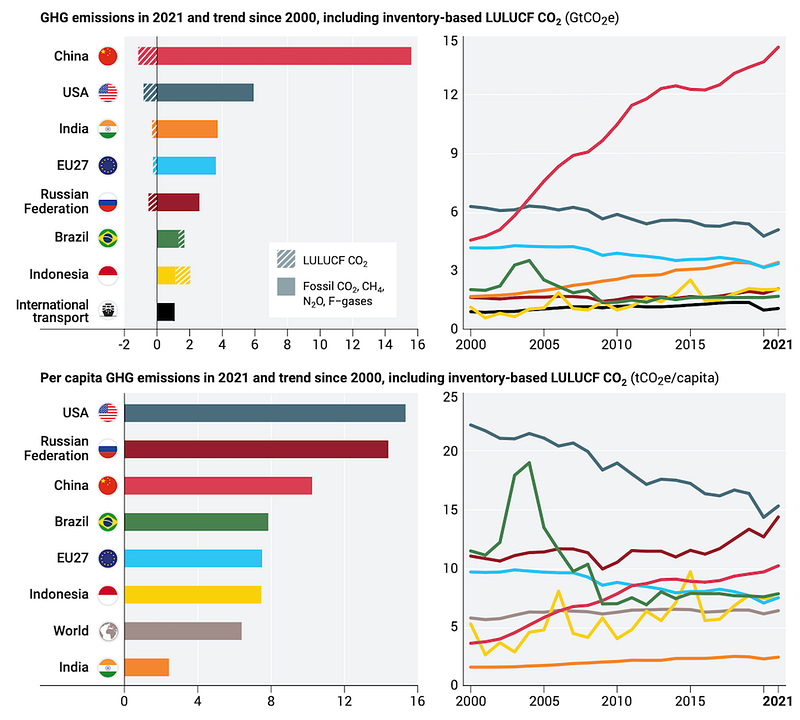
The three main greenhouse gases — carbon dioxide, methane, and nitrous oxide — increased by 1.2% from 2021 to 2022, setting a new all-time record of 57.4 gigatonnes of carbon dioxide equivalent (GtCO₂e). This marks a complete rebound from the declines seen during the COVID-19 pandemic (except for the transportation sector — thanks, Jeff).
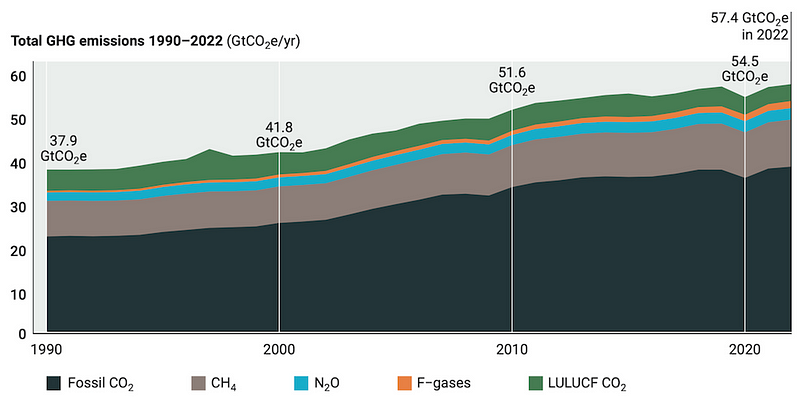
Emissions of methane, nitrous oxide, fluorinated gases, and land-use change (deforestation) account for a third of current global GHG emissions. CO₂ from fossil fuels is the main driver of the increase and is responsible for around two-thirds of current global GHG emissions. Because fossil fuels are far too cheap, considering their production and environmental costs. Globally, they received a subsidy of $5.9 trillion or 6.8 percent of GDP in 2020 — and are expected to increase to 7.4 percent of GDP in 2025. And, despite the UN-Secretary general in COP27 stating that “It is either a Climate Solidarity Pact — or a Collective Suicide Pact,” right now, it seems like we humans have taken the Collective Suicide Pact.
A UN report revealed that major fossil fuel producers are gearing up for expansions that would obliterate the planet’s carbon budget twice over. The report forewarns a 460% (!) increase in coal production, an 83% surge in gas, and a 29% in oil by 2030 — numbers that defy the 1.5°C threshold. About 90% of the upcoming carbon disaster from new oil and gas ventures between 2023 and 2050 can be traced back to just 20 countries. Leading the charge in this carbon emission debacle are India (coal), Saudi Arabia (oil ), and Russia (coal, oil, and gas).
Zooming in on the hypocrisy and recklessness, there’s the Planet Wreckers (United States, Canada, Australia, Norway, and the United Kingdom) that bear the greatest responsibility for the current state of the planet and the looming climate chaos. Carbon emissions are like a lease — the changes we’re experiencing today result from historic cumulative emissions, not just the emissions of the past few years.
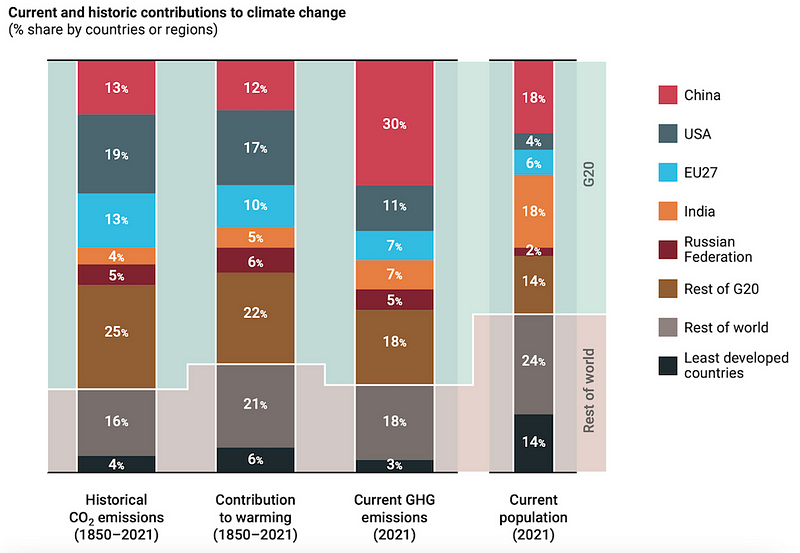
While China is often singled out for its high GHG emissions, it has contributed less to the warming we’ve seen so far than the United States (and only slightly more than the EU). This underscores the fact that high-income countries bear a disproportionate share of the warming the world is facing today. Despite representing 14% of the global population, the least developed countries are responsible for only 6% of current warming and 3% of current GHG emissions. High-income countries should pay for their larger responsibility in the climate crisis. Instead, disasters tend to hit the poorest or less prepared, and COP’s president is trying to deepen his dirty-fueled pockets.
No Funds Can Bring Back Lives
“We have delivered history today,” said Sultan Al Jaber, COP28’s president from the fossil menace UEA and chief executive of the national oil company Adnoc, to his fellow delegates.
History? The agreement on the first day of the UN’s Climate Summit 2023 was to operationalize the ‘Loss and Damage’ Fund. The UAE, Germany, the UK, Japan, and the US committed around $400 million to support poor countries affected by climate change.
The United States pledged $17.5 million. Is this a joke?
Tom Mitchell, executive director of the International Institute for Environment and Development, says the total amounts so far “are really, really very modest” and that some of the least developed countries see the US commitment as “a slap in the face.”
Tom is a nice guy, and he would never say that this is basically the US saying F-you to the rest of the world. But that is what it truly is. The US and all the other planet wreckers know that their emissions will hit poor and vulnerable countries first, not theirs.
Countries calling for the fund, especially those highly vulnerable to climate change, expect it to reach at least $100 billion per year eventually. We are only 99.6 billion away. And then, we also need to actually get the money to the front line of climate impacts.
How come COP’s President himself reveal that the UAE — with him as chairman, of course — will invest $30 billion in a climate finance vehicle called Alterra, a “vehicle like no other”, yet only $5 billion will be deployed as risk mitigation capital in the Global South?
This is just another layer to the high-profile, shady-intentions, climate-jobs after leaked documents revealed that Al Jaber has secretly used the climate summit role to push oil trade with foreign government officials.
And we still don’t know if we’re at 1.2 or 1.41 or 1.490532°C degrees above pre-industrial temperatures because we can’t agree on the relevant data and metrics?
Climate impacts, once projected for 2050, are already upon us. These are signs that the predicted mega-scale impacts are arriving far sooner than anticipated. Towns razed, failing crops, jeopardized water, and unbreathable air in unexpected places.
If this is (just) under 1.5 degrees, then imagine what 3 degrees would bring — entire regions uninhabitable, fundamental systems failing, and the fabric of society tearing apart. Recent groundbreaking research by the conservative, risk-assessing British Institute of Actuaries delivers a stark conclusion: half of our economies could be destroyed by 2070 50% of GDP. Consider the European heatwaves that claimed over 60,000 lives, and then imagine what will happen when similar heat thresholds are crossed in Latin America, the Sub-Sahara, or Southeast Asia. Another study links 5 million deaths annually to abnormal temperatures, likely to rise as climate impacts intensify. The point here isn’t to convince you of a specific number but to emphasize the scale of the challenge.
The countless, undisputable studies on climate change should urge world leaders to take immediate action and prevent us from carelessly plunging into a self-made apocalypse. This must start with a formal, agreed metric for the 1.5-degree threshold. And then communicating that to the world at every opportunity. We all deserve to have the stakes appropriately and compassionately explained, and the action-response made clear.
Because right now, it feels like we are being taken for fools.
Be loud.
Thank you for your thorough reading! And a shoutout to Tim Smedley for his unconditional support and editing feedback. He is the real deal. Subscribe for immediate insights and join the 400+ Antarctic Sapiens community for weekly thought-provoking content.


