Free AI web copilot to create summaries, insights and extended knowledge, download it at here
9642
Abstract
The correlation means that how one feature depend on other feature.</p><div id="f7bf"><pre><span class="hljs-keyword">def</span> <span class="hljs-title function_">histogram_intersection</span>(<span class="hljs-params">x, y</span>):
v = np.minimum(x, y).<span class="hljs-built_in">sum</span>().<span class="hljs-built_in">round</span>(decimals=<span class="hljs-number">1</span>)
<span class="hljs-keyword">return</span> v
s1 = pd.Series([<span class="hljs-number">.44</span>, <span class="hljs-number">.0</span>, <span class="hljs-number">.5</span>, <span class="hljs-number">.15</span>, <span class="hljs-number">.10</span>, <span class="hljs-number">.3</span>])
s2 = pd.Series([<span class="hljs-number">.0</span>, <span class="hljs-number">.5</span>, <span class="hljs-number">.2</span>, <span class="hljs-number">.14</span>, <span class="hljs-number">.19</span>, <span class="hljs-number">.24</span>])
s1.corr(s2, method=histogram_intersection)
<span class="hljs-comment">#Output:</span>
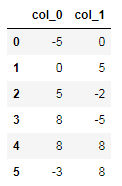
<span class="hljs-number">0.7</span></pre></div><p id="ea9a"><b>7. N_largest Method</b></p><p id="db68">In this method, it will return the most largest count occurred in the data frame.</p><div id="0f74"><pre>data = {<span class="hljs-string">'col_0'</span>: [-<span class="hljs-number">44</span>,<span class="hljs-number">0</span>,<span class="hljs-number">5</span>, <span class="hljs-number">15</span>, <span class="hljs-number">10</span>, -<span class="hljs-number">3</span>],
<span class="hljs-string">'col_1'</span>: [<span class="hljs-number">0</span>,<span class="hljs-number">5</span>,-<span class="hljs-number">2</span>, -<span class="hljs-number">14</span>, <span class="hljs-number">19</span>, <span class="hljs-number">24</span>]}
df = pd.DataFrame(data)
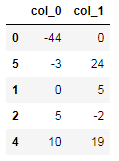
df.nlargest(<span class="hljs-number">5</span>, <span class="hljs-string">'col_0'</span>)
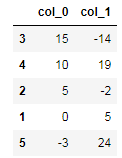
<span class="hljs-comment">#output:</span></pre></div><figure id="4d7c"><img src="https://cdn-images-1.readmedium.com/v2/resize:fit:800/1*4BW2QAdP6ZflaBC33XDQXw.png"><figcaption></figcaption></figure><p id="d66f"><b>8. N_Smallest Method</b></p><p id="1db2">In this method, it will return the most smallest count occurred in the data frame.</p><div id="ee77"><pre>data = {<span class="hljs-string">'col_0'</span>: [-<span class="hljs-number">44</span>,<span class="hljs-number">0</span>,<span class="hljs-number">5</span>, <span class="hljs-number">15</span>, <span class="hljs-number">10</span>, -<span class="hljs-number">3</span>],
<span class="hljs-string">'col_1'</span>: [<span class="hljs-number">0</span>,<span class="hljs-number">5</span>,-<span class="hljs-number">2</span>, -<span class="hljs-number">14</span>, <span class="hljs-number">19</span>, <span class="hljs-number">24</span>]}
df = pd.DataFrame(data)
df.nsmallest(<span class="hljs-number">5</span>, <span class="hljs-string">'col_0'</span>)
<span class="hljs-comment">#output:</span></pre></div><figure id="84bb"><img src="https://cdn-images-1.readmedium.com/v2/resize:fit:800/1*hjMDTsVjpiHZEUzPN71mkw.png"><figcaption></figcaption></figure><p id="cb30"><b>9. Unique Method</b></p><p id="abd3">This method is used to find the unique values in the features/columns.</p><div id="17d2"><pre>series = pd.Series([<span class="hljs-number">4.0</span>, <span class="hljs-number">6.0</span>, <span class="hljs-number">7.0</span>, <span class="hljs-number">6.0</span>, <span class="hljs-number">4.0</span>])
series.unique()
<span class="hljs-comment">#Output:</span>
array([<span class="hljs-number">4.</span>, <span class="hljs-number">6.</span>, <span class="hljs-number">7.</span>])</pre></div><div id="52c8" class="link-block">
<a href="https://readmedium.com/40-most-insanely-usable-methods-in-python-a983c78f5bfd">
<div>
<div>
<h2>40 Most Insanely Usable Methods in Python</h2>
<div><h3>Data cleaning and wrangling in data science and machine learning</h3></div>
<div><p>medium.com</p></div>
</div>
<div>
<div style="background-image: url(https://miro.readmedium.com/v2/resize:fit:320/0*jQnlimgu0VdPkTFh)"></div>
</div>
</div>
</a>
</div><div id="53ce" class="link-block">
<a href="https://readmedium.com/step-by-step-depth-introduction-of-matplotlib-with-python-8386d75b361d">
<div>
<div>
<h2>Step-by-Step Depth Introduction of Matplotlib with Python</h2>
<div><h3>A useful handful of examples for data science and machine learning projects</h3></div>
<div><p>medium.com</p></div>
</div>
<div>
<div style="background-image: url(https://miro.readmedium.com/v2/resize:fit:320/1*yifcgzdFj7blB_iXSeQ-LA.png)"></div>
</div>
</div>
</a>
</div><p id="2538"><b>10. Value_count Method</b></p><p id="586f">In this method, it will count the values that occurs repeatedly in the data frame or in series.</p><div id="74c8"><pre>series = pd.Series([<span class="hljs-number">4.0</span>, <span class="hljs-number">6.0</span>, <span class="hljs-number">7.0</span>, <span class="hljs-number">6.0</span>, <span class="hljs-number">4.0</span>])
series.unique()
<span class="hljs-comment">#Output:</span>
<span class="hljs-number">6.0</span> <span class="hljs-number">2</span>
<span class="hljs-number">4.0</span> <span class="hljs-number">2</span>
<span class="hljs-number">7.0</span> <span class="hljs-number">1</span>
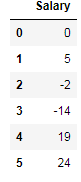
dtype: int64</pre></div><p id="f832"><b>11. Drop Method</b></p><p id="cb4b">This method very much useful in the data frame to remove the unnecessary columns from the data frame.</p><div id="36e8"><pre>data = {<span class="hljs-string">'Age'</span>: [-<span class="hljs-number">44</span>,<span class="hljs-number">0</span>,<span class="hljs-number">5</span>, <span class="hljs-number">15</span>, <span class="hljs-number">10</span>, -<span class="hljs-number">3</span>],
<span class="hljs-string">'Salary'</span>: [<span class="hljs-number">0</span>,<span class="hljs-number">5</span>,-<span class="hljs-number">2</span>, -<span class="hljs-number">14</span>, <span class="hljs-number">19</span>, <span class="hljs-number">24</span>]}
df2 = pd.DataFrame(data)
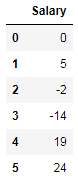
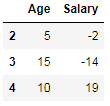
df2.drop(<span class="hljs-string">'Age'</span>, axis=<span class="hljs-string">'columns'</span>)
<span class="hljs-comment">#output:</span></pre></div><figure id="fc82"><img src="https://cdn-images-1.readmedium.com/v2/resize:fit:800/1*6gUUbnEHZfMemRqLDKiZmA.png"><figcaption></figcaption></figure><p id="5f48"><b>12. Head Method</b></p><p id="d77c">This method is used to view the some starting rows of the data frame.</p><div id="e89f"><pre>data = {<span class="hljs-string">'Age'</span>: [-<span class="hljs-number">44</span>,<span class="hljs-number">0</span>,<span class="hljs-number">5</span>, <span class="hljs-number">15</span>, <span class="hljs-number">10</span>, -<span class="hljs-number">3</span>],
<span class="hljs-string">'Salary'</span>: [<span class="hljs-number">0</span>,<span class="hljs-number">5</span>,-<span class="hljs-number">2</span>, -<span class="hljs-number">14</span>, <span class="hljs-number">19</span>, <span class="hljs-number">24</span>]}
df2 = pd.DataFrame(data)
df.head(<span class="hljs-number">2</span>)
<span class="hljs-comment">#output:</span>
Age Salary
<span class="hljs-number">0</span> -<span class="hljs-number">44</span> <span class="hljs-number">0</span>
<span class="hljs-number">1</span> <span class="hljs-number">0</span> <span class="hljs-number">5</span></pre></div><p id="f068"><b>13. Truncate Method</b></p><p id="c9f3">This method is useful to get the data based on the condition in the data frame.</p><div id="ebb6"><pre>data = {<span class="hljs-string">'Age'</span>: [-<span class="hljs-number">44</span>,<span class="hljs-number">0</span>,<span class="hljs-number">5</span>, <span class="hljs-number">15</span>, <span class="hljs-number">10</span>, -<span class="hljs-number">3</span>],
<span class="hljs-string">'Salary'</span>: [<span class="hljs-number">0</span>,<span class="hljs-number">5</span>,-<span class="hljs-number">2</span>, -<span class="hljs-number">14</span>, <span class="hljs-number">19</span>, <span class="hljs-number">24</span>]}
df2 = pd.DataFrame(data)
df2
<span class="hljs-comment">#output:</span></pre></div><figure id="7b8c"><img src="https://cdn-images-1.readmedium.com/v2/resize:fit:800/1*CLB5mL4Fc8TCur2LaWWg3g.png"><figcaption></figcaption></figure><div id="0a5b"><pre><span class="hljs-comment">#truncate the data by using index as condition.</span>
df2.truncate(before=<span class="hljs-number">2</span>, after=<span class="hljs-number">4</span>)
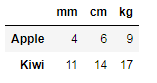
<span class="hljs-comment">#output:</span></pre></div><figure id="0ec7"><img src="https://cdn-images-1.readmedium.com/v2/resize:fit:800/1*Ot5FS9VnNrnyjT1BQ5L-3A.png"><figcaption></figcaption></figure><p id="ca84"><b>14. Filter Method</b></p><p id="5815">This method is used to take the small subset from the data frame.</p><div id="f208"><pre>df = pd.DataFrame(np.array(([<span class="hljs-number">4</span>,<span class="hljs-number">6</span>,<span class="hljs-number">9</span>], [<span class="hljs-number">11</span>,<span class="hljs-number">14</span>,<span class="hljs-number">17</span>])),
index=[<span class="hljs-string">'Apple'</span>, <span class="hljs-string">'Kiwi'</span>],
columns=[<span class="hljs-string">'mm'</span>, <span clas
Options
s="hljs-string">'cm'</span>, <span class="hljs-string">'kg'</span>])
df
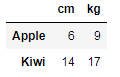
output:</pre></div><figure id="c859"><img src="https://cdn-images-1.readmedium.com/v2/resize:fit:800/1*yroqA3XMHrpVzzsZnJdJjQ.png"><figcaption></figcaption></figure><div id="5840"><pre>df.<span class="hljs-built_in">filter</span>(items=[<span class="hljs-string">'cm'</span>, <span class="hljs-string">'kg'</span>])
<span class="hljs-comment">#output:</span></pre></div><figure id="047f"><img src="https://cdn-images-1.readmedium.com/v2/resize:fit:800/1*RSUP_k0HwNCaX3izAYN94A.png"><figcaption></figcaption></figure><p id="3b51"><b>15. Interpolation Method</b></p><p id="efef">In this method, the interpolation method is used to fill the nan values in linear approach in series or in data frame.</p><div id="9e7b"><pre>series = pd.Series([<span class="hljs-number">11</span>, <span class="hljs-number">12</span>, np.nan, <span class="hljs-number">14</span>])
series.interpolate()
<span class="hljs-comment">#output:</span>
<span class="hljs-number">0</span> <span class="hljs-number">11.0</span>
<span class="hljs-number">1</span> <span class="hljs-number">12.0</span>
<span class="hljs-number">2</span> <span class="hljs-number">13.0</span>
<span class="hljs-number">3</span> <span class="hljs-number">14.0</span>
dtype: float64
<span class="hljs-comment">#if we give padding (existing values) and limit </span>
series = pd.Series([<span class="hljs-number">11</span>, np.nan, <span class="hljs-number">12</span>, np.nan,np.nan,np.nan,<span class="hljs-number">14</span>])
series.interpolate(method=<span class="hljs-string">'pad'</span>, limit=<span class="hljs-number">2</span>)
<span class="hljs-comment">#output:</span>
<span class="hljs-number">0</span> <span class="hljs-number">11.0</span>
<span class="hljs-number">1</span> <span class="hljs-number">11.0</span>
<span class="hljs-number">2</span> <span class="hljs-number">12.0</span>
<span class="hljs-number">3</span> <span class="hljs-number">12.0</span>
<span class="hljs-number">4</span> <span class="hljs-number">12.0</span>
<span class="hljs-number">5</span> NaN
<span class="hljs-number">6</span> <span class="hljs-number">14.0</span>
dtype: float64</pre></div><p id="238b">In padding and limit parameters, the nan values are filled with existing values and the limit=2 means to fill up to two consecutive values.</p><p id="9f24"><b>16. Isna Method</b></p><p id="0df5">This method is used to detect the missing values in the data frame or series.</p><div id="7abc"><pre><span class="hljs-keyword">import</span> numpy <span class="hljs-keyword">as</span> np
<span class="hljs-keyword">import</span> pandas <span class="hljs-keyword">as</span> pd
series1 = pd.Series([<span class="hljs-number">5</span>, <span class="hljs-number">6</span>, np.NaN])
series1.isna()
<span class="hljs-comment">#output:</span>
<span class="hljs-number">0</span> <span class="hljs-literal">False</span>
<span class="hljs-number">1</span> <span class="hljs-literal">False</span>
<span class="hljs-number">2</span> <span class="hljs-literal">True</span>
dtype: <span class="hljs-built_in">bool</span></pre></div><p id="0271"><b>17. Replace Method</b></p><p id="35b5">This method is used to replace the value with the given value in the series.</p><div id="2870"><pre>series1 = pd.Series([<span class="hljs-string">"Amit"</span>, <span class="hljs-string">"Apple"</span>, <span class="hljs-string">"Orange"</span>, <span class="hljs-string">"Banana"</span>, <span class="hljs-string">"Kiwi"</span>])
series1.replace(<span class="hljs-string">"Apple"</span>, <span class="hljs-string">"Avacado"</span>)
<span class="hljs-comment">#output:</span>
<span class="hljs-number">0</span> Amit
<span class="hljs-number">1</span> Avacado
<span class="hljs-number">2</span> Orange
<span class="hljs-number">3</span> Banana
<span class="hljs-number">4</span> Kiwi
dtype: <span class="hljs-built_in">object</span></pre></div><p id="7362"><b>18. Argmin and argmax Method</b></p><p id="1145">These methods are used to find the index position of minimum and maximum value.</p><div id="88b0"><pre><span class="hljs-keyword">import</span> pandas <span class="hljs-keyword">as</span> pd
<span class="hljs-comment">#data 1</span>
s = pd.Series({<span class="hljs-string">'Apple'</span>: <span class="hljs-number">90.0</span>, <span class="hljs-string">'Orange'</span>: <span class="hljs-number">10.0</span>, <span class="hljs-string">'Banana'</span>: <span class="hljs-number">20.0</span>,
<span class="hljs-string">'Kiwi'</span>: <span class="hljs-number">300.0</span>})
<span class="hljs-built_in">print</span>(s.argmax())
<span class="hljs-built_in">print</span>(s.argmin())
<span class="hljs-comment">#output:</span>
<span class="hljs-number">3</span>
<span class="hljs-number">1</span>
<span class="hljs-comment">#data 2</span>
series = pd.Series([<span class="hljs-number">4.0</span>, <span class="hljs-number">6.0</span>, <span class="hljs-number">7.0</span>, <span class="hljs-number">12.0</span>, <span class="hljs-number">15.0</span>])
<span class="hljs-built_in">print</span>(series.argmax())
<span class="hljs-built_in">print</span>(series.argmin())
<span class="hljs-comment">#output:</span>
<span class="hljs-number">4</span>
<span class="hljs-number">0</span></pre></div><p id="f290"><b>19. Compare Method</b></p><p id="1786">In this method, the values are compared with the series of other column, if they are not similar then the output will print those rows.</p><div id="0b5a"><pre>series1 = pd.Series([<span class="hljs-string">"Amit"</span>, <span class="hljs-string">"Apple"</span>, <span class="hljs-string">"Orange"</span>, <span class="hljs-string">"Banana"</span>, <span class="hljs-string">"Kiwi"</span>])
series2 = pd.Series([<span class="hljs-string">"Amit"</span>, <span class="hljs-string">"Orange"</span>, <span class="hljs-string">"Orange"</span>, <span class="hljs-string">"Banana"</span>, <span class="hljs-string">"Lemon"</span>])
series1.compare(series2)
<span class="hljs-comment">#output:</span>
self other
<span class="hljs-number">1</span> Apple Kiwi
<span class="hljs-number">4</span> Orange Lemon</pre></div><p id="5e24"><b>20. Groupby Method</b></p><p id="a0bd">This method is used to group all the same classes in the features based on the column name.</p><div id="63dd"><pre>df = pd.read_csv(<span class="hljs-string">"sample.csv"</span>)
df
<span class="hljs-comment">#output:</span>
Fruits Weight
<span class="hljs-number">0</span> Apple <span class="hljs-number">10</span>
<span class="hljs-number">1</span> Orange <span class="hljs-number">15</span>
<span class="hljs-number">2</span> Apple <span class="hljs-number">20</span>
<span class="hljs-number">3</span> Apple <span class="hljs-number">30</span>
<span class="hljs-number">4</span> Orange <span class="hljs-number">25</span>
<span class="hljs-comment">#groupby operation based on Fruits column</span>
df.groupby(pd.Grouper(key=<span class="hljs-string">"Fruits"</span>)).mean()
<span class="hljs-comment">#output:</span>
Weight
Fruits
Apple <span class="hljs-number">20.0</span>
Orange <span class="hljs-number">20.0</span></pre></div><p id="20da">I hope you like the article. Reach me on my <a href="https://www.linkedin.com/in/data-scientist-95040a1ab/">LinkedIn</a> and <a href="https://twitter.com/amitprius">twitter</a>.</p><h2 id="7d85">Recommended Articles</h2><p id="1be5">1. <a href="https://pub.towardsai.net/8-active-learning-insights-of-python-collection-module-6c9e0cc16f6b">8 Active Learning Insights of Python Collection Module</a>
2. <a href="https://pub.towardsai.net/numpy-linear-algebra-on-images-ed3180978cdb?source=friends_link&sk=d9afa4a1206971f9b1f64862f6291ac0">NumPy: Linear Algebra on Images</a>
3. <a href="https://pub.towardsai.net/exception-handling-concepts-in-python-4d5116decac3?source=friends_link&sk=a0ed49d9fdeaa67925eac34ecb55ea30">Exception Handling Concepts in Python</a>
4. <a href="https://pub.towardsai.net/pandas-dealing-with-categorical-data-7547305582ff?source=friends_link&sk=11c6809f6623dd4f6dd74d43727297cf">Pandas: Dealing with Categorical Data</a>
5. <a href="https://pub.towardsai.net/hyper-parameters-randomseachcv-and-gridsearchcv-in-machine-learning-b7d091cf56f4?source=friends_link&sk=cab337083fb09601114a6e466ec59689">Hyper-parameters: RandomSeachCV and GridSearchCV in Machine Learning</a>
6. <a href="https://readmedium.com/fully-explained-linear-regression-with-python-fe2b313f32f3?source=friends_link&sk=53c91a2a51347ec2d93f8222c0e06402">Fully Explained Linear Regression with Python</a>
7. <a href="https://readmedium.com/fully-explained-logistic-regression-with-python-f4a16413ddcd?source=friends_link&sk=528181f15a44e48ea38fdd9579241a78">Fully Explained Logistic Regression with Python</a>
8. <a href="https://pub.towardsai.net/data-distribution-using-numpy-with-python-3b64aae6f9d6?source=friends_link&sk=809e75802cbd25ddceb5f0f6496c9803">Data Distribution using Numpy with Python</a>
9. <a href="https://pub.towardsai.net/decision-trees-vs-random-forests-in-machine-learning-be56c093b0f?source=friends_link&sk=91377248a43b62fe7aeb89a69e590860">Decision Trees vs. Random Forests in Machine Learning</a>
10. <a href="https://pub.towardsai.net/standardization-in-data-preprocessing-with-python-96ae89d2f658?source=friends_link&sk=f348435582e8fbb47407e9b359787e41">Standardization in Data Preprocessing with Python</a></p></article></body>