
The Ultimate Guide to Zabbix Monitoring: From Servers to Cloud and Everything In Between!
Zabbix is an open-source monitoring tool that tracks the performance and availability of network devices, servers, applications, and other IT assets. It provides real-time data monitoring, alerting, and visualization to assist organizations in ensuring the optimal performance and health of their IT infrastructure.
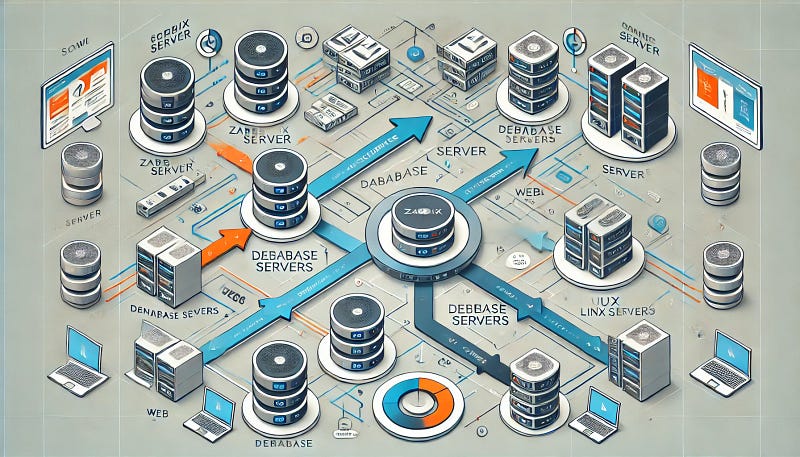
Zabbix can monitor a large number of components, including:
Server resources: include CPU usage, memory, disk space, network interfaces, etc.Network Devices: Bandwidth usage, latency, packet loss, etc.Applications:Databases, web servers, mail servers, and custom applications, etc.Services:DNS, DHCP, FTP, Telnet, Ping and HTTP. etc.Virtualization Platforms: VMware, Hyper-V, and others.Cloud services:Amazon Web Services, Azure, and Google Cloud.Environmental Factors:Temperature, humidity, and other environmental variables.
SolarWinds: Nagios: Grafana: Datadog:
Due to its robust feature set, scalability, and ease of use. It provides a comprehensive solution for monitoring diverse IT environments, and its flexibility allows for customization to meet specific needs.
Supports Many Integrations with other Tools like Grafana, Prometheus, ServiceNow, Jira, . etc.
Zabbix Server
This is the heart of the Zabbix software. The Server can perform simple service checks on networked services (such as web servers and mail servers), but it is also the central component to which the Agents will report availability and integrity information and statistics. The Server is the central repository for all configuration, statistical, and operational data, and it is the entity in the Zabbix software that actively alerts administrators when a problem occurs in any of the monitored systems.
Zabbix proxy
Zabbix proxy used to get the metrics from clients on behalf of Zabbix server. its most used for Remote locations and access restricted network zones.
Zabbix Proxies can also be used to distribute load of a single Zabbix Server. In this case, only Proxies collect data making processing on the Server less CPU and disk I/O hungry.
Proxy get all the metrics and saves into Databases, and send the data to Zabbix server for centralized monitoring.
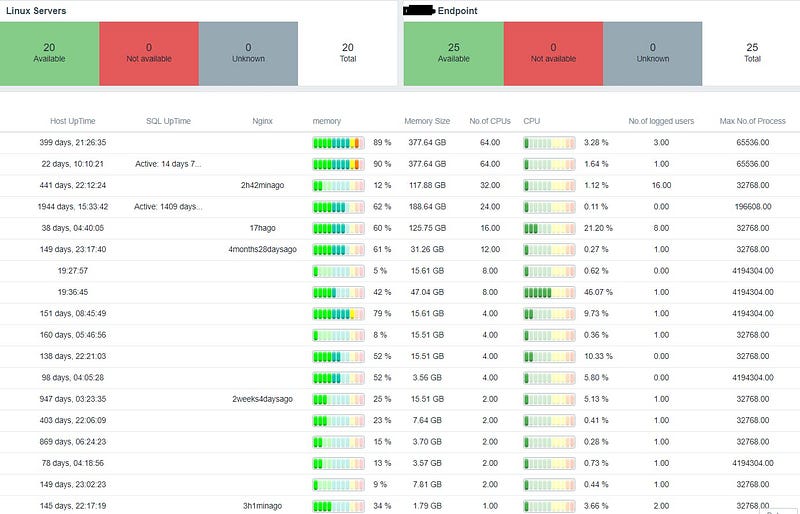
Dashboard
Allow to group multiple items and metrics in the same type of devices on the dashboard.
we can create multiple Dashboards and its also includes Maps, Graphs, and screens.
Visualize the data collected by Zabbix , and show the data in Multiple formats like Graph, Pie chart, Analog, Log Format, and Text. etc.
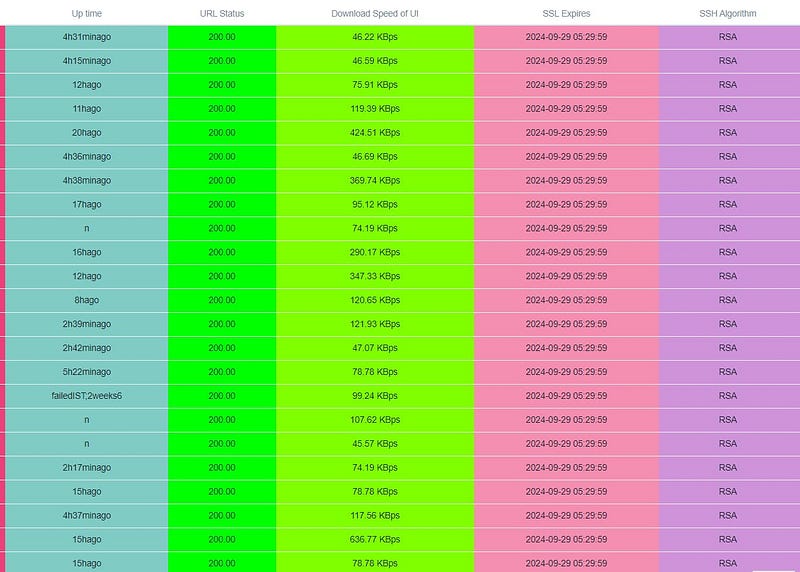
Server Status:
Website Status:
Screens
It's used for a Slide show. Move the pages in the Dashboard automatically and refresh the values in the specified period.
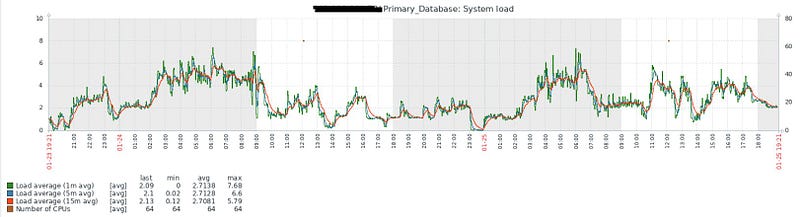
Graph
Metrics data are converted into time series values and added in X and Y values, for specific period.
Zabbix Agent
- Needs to be installed on clients. it collects metrics like CPU, Memory, Disk, Network, and more.
- Communication between the Zabbix server and the Zabbix agent is typically done using the Zabbix protocol
Zabbix Agent2
- Zabbix Agent 2 supports multiple protocols for communication, including gRPC, HTTP/HTTPS, and MQTT.
- Zabbix Agent 2 is aimed at providing better performance and scalability, written in go lang.
Store data
Zabbix supports multiple Databases PostgreSQL, SQLite, and Oracle. Using Database Zabbix stores all the collected metrics, Components, Templates, items, host, and all the Zabbix web components.
Host
Network-connected devices are configured in hosts. it can be Servers, Network Switches, Firewalls, Websites, Databases, etc.
- Hostname: The name or network address used to identify the host. This can be an IP address, DNS name, or any other identifier.
- Visible Name: A user-friendly name for the host, which is used in the Zabbix user interface.
- Groups: Hosts can be organized into groups to simplify management and configuration. Groups are useful for categorizing hosts based on their functions or locations.
- Templates: Hosts can be associated with templates, which are predefined sets of items, triggers, and other monitoring configurations. Templates help in standardizing monitoring across multiple hosts.
- Interfaces: Specifies how Zabbix should connect to the host. This includes the type of connection (agent, SNMP, JMX, etc.) and the necessary connection details.
Item
- Type: Determines the kind of data that the item will collect (e.g., numeric, character, log, etc.).
- Key: A unique identifier for the item on the host. It specifies how Zabbix will retrieve data from the monitored device.
- Data Type: Defines the format of the collected data (e.g., float, integer, character).
- Update Interval: Specifies how often Zabbix should collect data for this item.
- History Storage Period: Defines how long historical data for the item should be retained in the database.
Trigger
Trigger configured from items. If the item value has changed to a specific pattern in a particular time trigger will indicate to zabbix.
- Expression: The core of a trigger is its expression, which defines the condition that, when satisfied, triggers an alert. The expression typically involves comparing the current value of an item with a defined threshold or pattern.
- Severity: Triggers are assigned a severity level, indicating the importance or seriousness of the triggered event. The severity level helps prioritize and classify events based on their impact.
- Dependencies: Triggers can be dependent on other triggers. Dependencies help avoid flooding the system with alerts when the root cause of a problem is known and already being addressed.
- Recovery Expression: Specifies the condition under which a trigger is considered to have recovered. When the recovery condition is met, Zabbix generates a recovery event, indicating that the issue has been resolved.
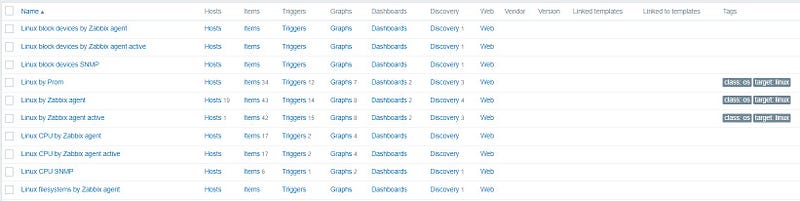
Template
Pre-defined functions for monitoring the end devices. It includes items, Triggers, Graphs, web configurations, Discovery rules, Applications, and linked Templates.
Ex: Linux Templates in Zabbix
All the Webhook, Email, Slack, etc, configuration saved in Media Types. Using media types alerts will send to users as per trigger Action configurations.
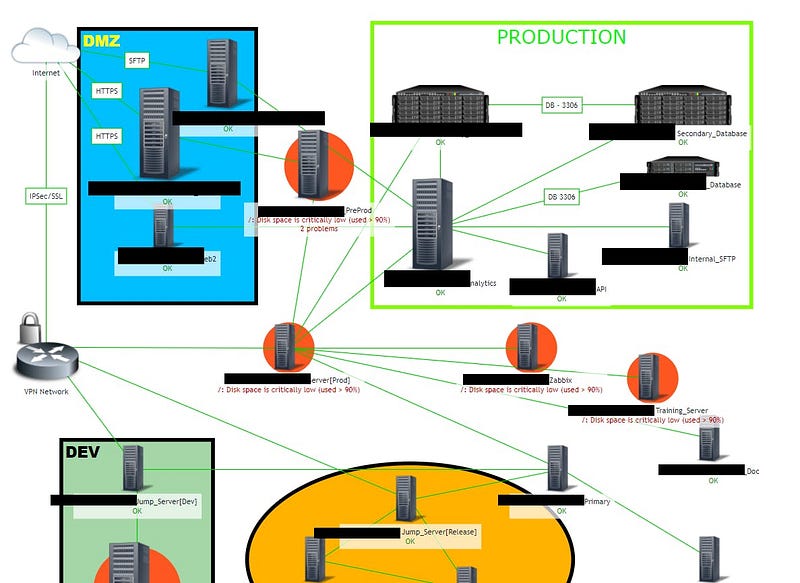
Maps
Identify the devices and how they are interconnected with each other. we can create the Network Map on our own, and create the connection flow across devices. Through the network able to identify the device issues where the service failed by an easy way.
Inventory Management: Automated tools can maintain an up-to-date inventory of all devices in the network.
LLD — low-level discovery
Using low-level discover Zabbix discovers the new hosts or items based on the discovery rules.
Example:
we have installed the Zabbix agent for 50 Linux servers, if we configure the all Hosts manually we need time, To achieve this Zabbix can monitor the network and add the hosts based on conditions it will create a host in Zabbix server using the discovery mechanism.
Follow for More:
LinkedIn: https://www.linkedin.com/in/karthick-dkk/ Medium: https://karthidkk123.medium.com/ Github: https://github.com/karthick-dkk/ Hashnode: https://karthick-dk.hashnode.dev/ Dev.to: https://dev.to/karthickdkk


