
Your Stocks Will Lose Money and That’s Okay
Clarifying a common misconception among inexperienced investors.
Your stocks will lose money, and that’s okay.
When we first invest, we subconsciously expect our investments to climb, churning out healthy gains year after year. After all, the average annual return of the S&P 500 is a hair over 10%.
But that figure can be misleading if you’re unfamiliar with investing and the stock market. The S&P 500 has only had annual returns between 8% and 12% six times since 1926.
In reality, stock prices are much more volatile.
From January 1928 to December 2017, the S&P 500 (which was the S&P 90 up until 1957) was positive 53% of the time on a daily basis. In other words, the odds of having a positive return on any given day were roughly that of a coin flip.
Red days are practically as common as green days.
The good news: if you take a step back and look at the stock market from an annual perspective, it doesn’t have red years nearly as often as red days. Hence why the average return is a positive 10%.
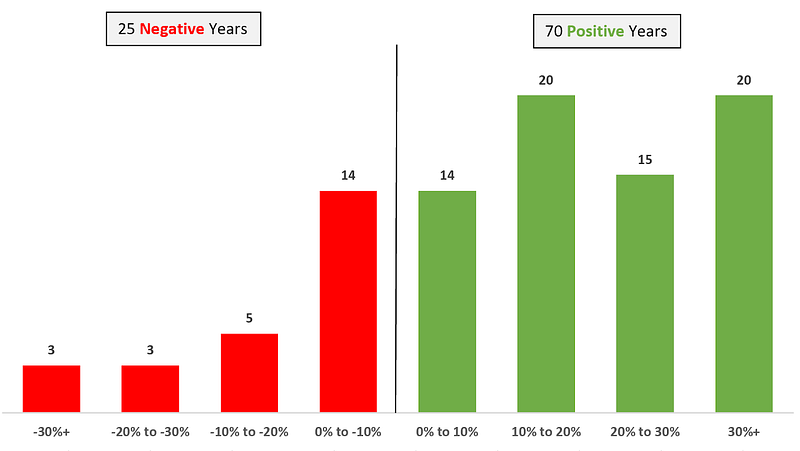
How many years has the stock market lost money?
From 1926 to 2020, the S&P 500 experienced negative annual returns 26.3% of the time. That’s only 25 years out of 95.
On the other side of that statistic, the market produced positive annual returns 70 times, eclipsing greater than 30% returns 20 times.
You can’t predict the stock market’s movements — especially on a daily basis — but it trends upward in the long run.
Beyond that, what should we take away from this Christmasy chart?
Normalize losses
Normalize losses — especially from a day-to-day perspective. I know, it sounds ridiculous, but I see too many people get restless when their stocks don’t match their unrealistic expectations.
That doesn’t mean shrug your shoulders at your portfolio if it continues to experience losses year after year. There’s a good chance that something is wrong with your investment strategy if that’s the case.
Instead, all I’m saying is to keep your emotions in check. Down days (and years) happen.
The best way to prepare for and counter investment panic is to have a plan. Before you invest, here are a few questions you should answer:
- What is my investment timeline? In other words, when do you anticipate needing the funds?
- What is your price target for each particular investment?
- Does the investment align with your risk tolerance?
- How would a market downturn impact this investment? For instance, a volatile, low-volume growth stock would have a lower floor than a stable, mature company with high trading volumes.
Knowing these answers will help you normalize and manuever through those rough market days.
Do you want to learn more about personal finance? But without the complicated jargon and dry explanations? Sign up here for Bits — our personal finance newsletter.