You say you want statistical significance?
“What is the minimum sample needed to determine statistical significance?”
This is possibly the most common question I have received working as a data scientist for companies that are looking to test new features in their product, searching for new creative direction, or aiming to optimize user experience.
Let’s first start with all the pitfalls I have personally witnessed:

Pitfall Number 1:
Since I work in marketing and we are mainly looking at conversion rates, the main argument I hear is:
“We don’t have enough installs/clicks to determine statistical significance”
However, if you are trying to measure something like click through rate (CTR = clicks/impressions) then you will actually care about your entire sample, not just those who clicked on your ad. That is, you care about all the (unique) impressions you served. Likewise, if you were measuring conversion rate (CVR = installs/clicks) then you would care about all clicks to the site/app.
This is similar to how you would think about a clinical trial. Your sample is determined as the total number of people in each treatment group, not just those who reacted to the treatment.

Now that we have that straight, we can move into the other pitfalls that come up..
Pitfall Number 2:
Let’s assume the test objectives have been set, budget has been allocated, and the test is in progress. Of course, everyone is eager to how the test is performing because, well, decisions need to be made and time is money. So someone is dedicated to constantly monitoring the test, checking significance every step of the way.
If this is what you are doing, STOP! This will, many times more than not, lead you to ending a test early the moment significance is found and lead to false positives.
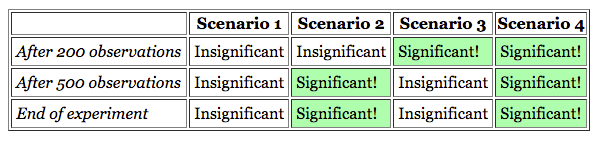
To gain a better understanding, assume you have an experiment set up and you evaluate results after 200 observations and 500 observations. Below are the different scenarios that can result:
However, if you ended the test the moment you saw significance, it would result in something like this:
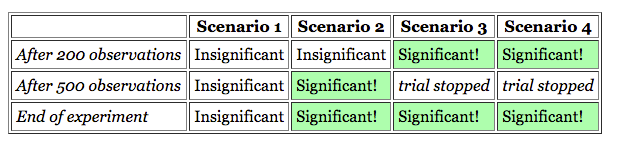
Notice that this method has led you to increasing the ratio of significant to insignificant results. “Therefore, the reported significance level — the “percent of the time the observed difference is due to chance” — will be wrong.”
For more about the implications of this, read here.
Pitfall Number 3:
That moment when statistical significance is determined and there is no conversation around practical significance. Sometimes it could be as small as a 0.5% difference between control and treatment group!
I mean great, it’s statistically significant, but is it actionable? This will depend on the context…
Now that we’ve covered all that, let’s discuss specific actions we can take to overcome these issues.
- Determine sample size before starting the test (aka Power Analysis).
- Refrain from checking the results of your test until you have reached the specified number of samples!
This will help immensely with getting clean and accurate results of your test, which could have costed a LOT of money.
So let’s get started…
Minimum Sample Size
Let’s say you got tasked with this job — to find the minimum sample size for an upcoming experiment. What would you do? Google a sample size calculator, right? THAT’S RIGHT! Which will lead you to sites like:
Easy peasy. You start playing with the numbers, but wait..
What’s an effect size?? Why does a smaller effect size lead to a much larger sample size?? Power, what’s power? BAH!
You start looking up effect size, and dig deep into your memory try to remember the statistics you learned years ago! Not happening..

Okay, okay..breathe! Let’s start from the beginning.
To determine the minimum sample size needed for proper evaluation, we need to understand the intimate relationship between all the factors that play into the calculation, which are:
- Effect Size
- Significance level (Probability of a Type 1 Error)
- Power (Probability of a Type 2 Error)
For the last two inputs, we can use recommended values that are used in academia (the rules can be more flexible for industry applications) which is a significance (alpha) value of 0.05 and a power of 0.8. So, that only leaves us with one value that we need to determine — effect size. Great, right? Maybe…
This particular input requires a little bit of thought (and some light calculations) since effect size will change depending on what you are trying to measure.
By definition, effect size represents the difference in means between treatment groups you want to detect. Keep in mind: the smaller the effect you want to measure, the more samples you will need. So, you’ll want to think about the minimum practical difference you care to measure, given the constraint of your budget.
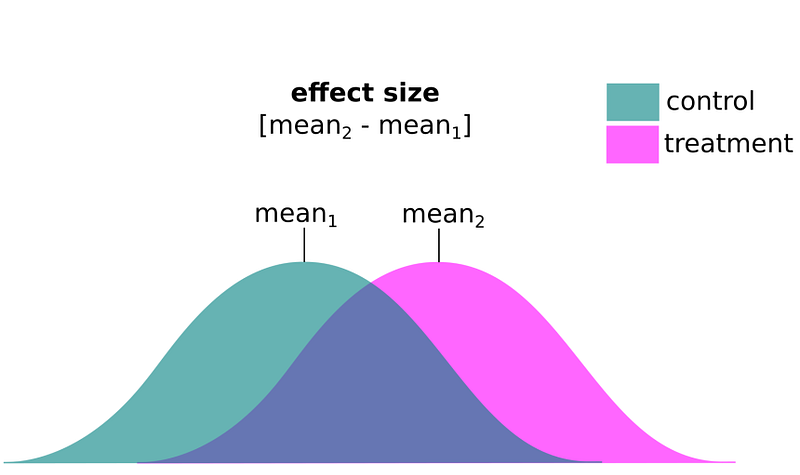
Cohen’s d represents the standardized version of effect size where values of 0.1, 0.3, and 0.5 correspond to small, medium, and large effects. But depending on your use-case, the standardized effect size you want to measure may be very small (even smaller than 0.1!).
For example, say you have a control group and a treatment group and you want to measure an absolute difference of 1%. Let’s also assume you know the baseline conversion rate to be 4% from historical knowledge or past experiments. Then the relative effect will be (5–4)/4 or 25% — and since it’s a binomial distribution, you can also calculate the standard deviation as sqrt(p*q) = 0.195 giving a standardized effect size of 0.01/0.195 or 0.05. Then the absolute effect size is 1%, the relative effect size is 25% and the standardized effect size will be about 0.05.
Armed with this information, you can now take the effect size, alpha, and power and plug into your favorite sample size calculator. Or you can use R by leveraging the pwr library and using the following or similar code:
pwr.anova.test(k = , n = , f = , sig.level = , power = )
By filling in k (number of treatment groups), f (standardized effect size), sig.level (0.05) and power (0.8), it will spit back out to you the recommended sample size needed per variant.

Congrats! Now it’s on you to educate your company about why they shouldn’t constantly check the results of the test until you’ve reached at least that many in your sample.
Queue the end of the test. Now it’s up to you to evaluate the test, but I’ll save that for another day..