
Why The Stock Market Crash Will Get Worse
What to watch out for heading into the end of the year
For most of my time as an investor, I was bullish. Aggressively buying and holding stocks made more sense as companies continued to grow their revenue and earnings. Unprofitable companies were narrowing their losses and getting close to profitability. We even saw some of these companies report several profitable quarters and achieve 10x stock price growth.
Now we find ourselves in the reverse scenario, with many assets plunging from their all-time highs. Some stocks have fallen well over 50% from their all-time highs, and it’s easy to think the worst is over. Investors will argue that buying stocks now presents a terrific long-term opportunity despite short-term volatility.
We got here due to a combination of factors. Stimulus strengthened the consumer and propped up stock valuations. Tech companies reported record earnings and revenue growth in 2021, proving the stock market’s resilience during the pandemic. Then came reality. The Fed pumped so much money into the market and created inflation.
By definition, inflation only occurs from increases in the money supply, and only the government has the authority to increase the money supply. Raising interest rates reduces the money supply and helps lower inflation…by crushing the consumer in the process.
Concerns with the Buy and Hold Strategy
The buy and hold strategy is pitched as a time tested way to increase your total returns. Investing money into the stock market now gives it multiple decades to compound over time. Furthermore, since the ‘average rate of return is 8%,’ assets should perform over time. If you look at the Google graph for the S&P 500’s ‘max’ history, you’ll see a charming chart that portrays continuous progress with some dips.
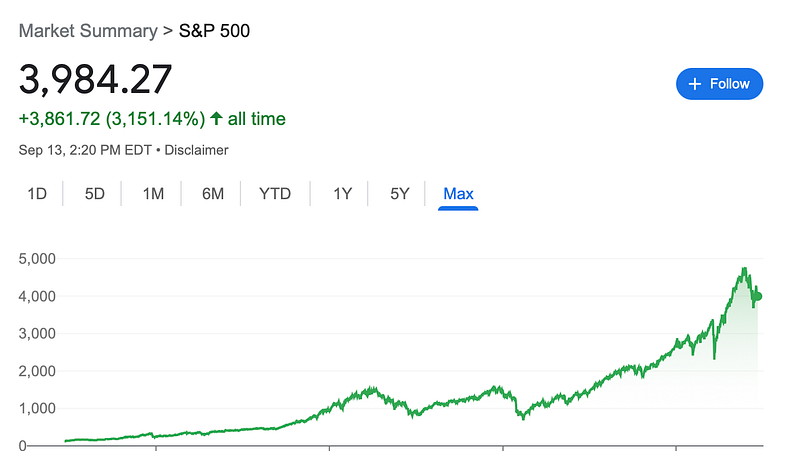
The graph does not include dividends, which would increase your returns even more. Some people also reinvested those dividends. Here’s the glaring issue with this graph: you only get to see historical data from 1982 onward. You don’t get to see how many decades it took for the stock market to recover from the peak in the 1960s.
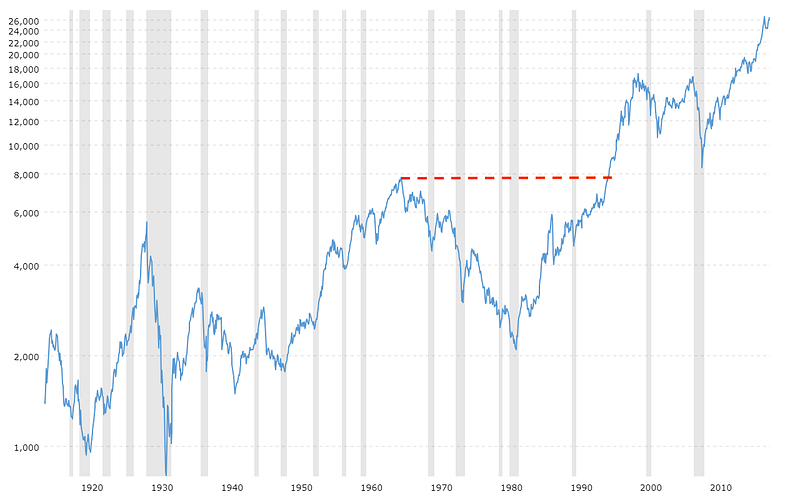
The graph depicts the DOW’s price movement over 100 years. If you invested in 1965 and followed the buy and hold mentality, it would have taken you three decades to get back to even (excluding dividends, reinvestments, and dollar-cost averaging).
You also have to make two assumptions during this three decade stretch:
- The investor actually held onto their positions for the entire 30 years
- The investor did not have to pull out any funds for retirement or other expenses.
Those are two gigantic assumptions. Most investors didn’t live and invest in the 70s, myself included. We have endured crashes like the Great Recession and the 2020 pandemic flash crash, but the stock market experienced quick recoveries during both of those crashes.
It took a little over five years to reach pre-recession highs and six months to reach pre-covid flash crash highs. During both of those economic cycles, the Federal Reserve was on our side. They printed money and allowed the market to operate with low interest rates. Quantitative easing also helped us experience the longest bull run in history.
The Fed is no longer our friend. Inflation is still rising, and the Fed is committed to raising interest rates and tightening the balance sheet. We’re getting hit from multiple angles.
Some people will claim we are not in a recession because of the unemployment rate and strong consumer spending. Everything is supposed to magically settle and we’ll be back at all-time highs in a year or two. I’ll point out my concerns with both:
Consumer spending — It’s been fueled by debt lately, and higher inflation will result in higher consumer spending. People have to spend more money to get the same amount of gas, groceries, and other essentials.
Unemployment rate — Did you know that if you are unemployed and haven’t looked for a job in four weeks, you don’t count on the unemployment rate? This rate only considers people working and looking for work. It doesn’t include people who are unemployed but stopped looking. The Labor Force Participation Rate is a noteworthy gauge that reflects how many Americans are in the labor force.
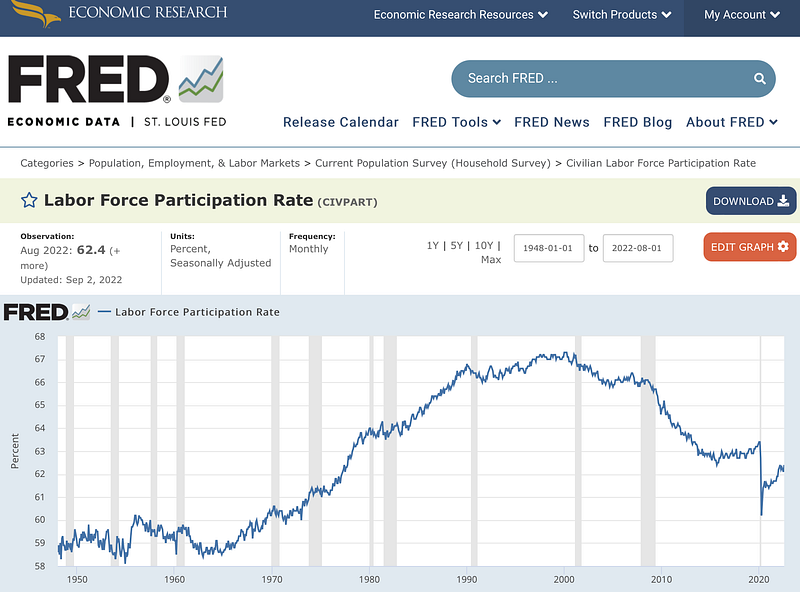
The Labor Participation Rate still hasn’t reached its pre-dot-com bubble high, and we haven’t recovered to pre-pandemic levels. Retirees who no longer seek work will hurt the Labor Force Participation Rate and not impact the unemployment rate. The Labor Force Participation Rate also includes anyone who is 15 years or older, further skewing the number. However, this rate gives us a better insight into economic output than the unemployment rate, and it includes people who stopped looking for jobs.
Poor Q3 and Q4 Earnings Will Inflate Valuations
Valuations of high-flying growth stocks have already nosedived. Some investors are using stock price crashes to justify starting new positions and waiting for a new all-time high. However, some of these same stocks still have more room to fall.
I’ll use Nvidia as an example. I have a bearish opinion on this stock and multiple puts, so I will benefit if this stock’s price continues to tumble.
Nvidia currently has a P/E of 43.03 based on this graph from Y-Charts.
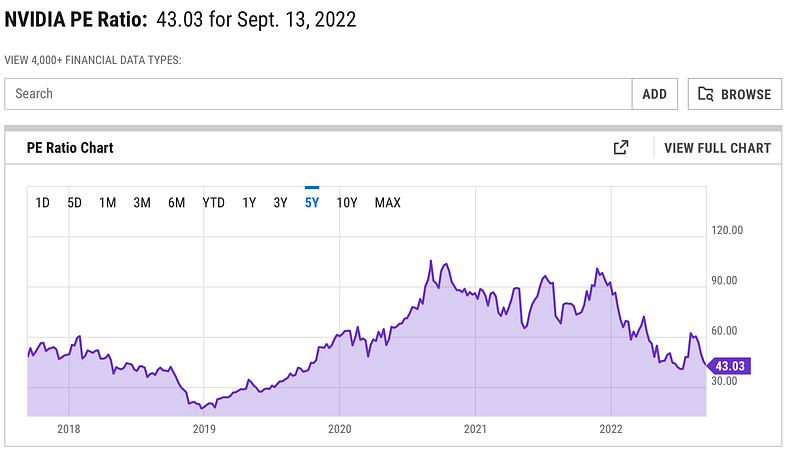
The company made $7.7 billion over the past 12 months and has a $327 billion market cap at the time of writing. 327 / 7.7 = 42.36. It’s not the 43.03 that Y-Charts has, but it’s close enough for our example.
Nvidia’s Q3 2022 earnings won’t be as good as their Q3 2021 earnings. The company has to navigate current economic conditions and recent U.S. regulations. Nvidia saw a 72% year-over-year net income drop in Q2 2022, clearing $656 million.
Nvidia cleared $2.4 billion in Q3 2021. If they clear $600 million (75% YOY decline), earnings get reduced by $1.8 billion for the P/E ratio. Under this scenario, the equation becomes 327 / 5.9 = 55.42 P/E.
Many companies are faltering and have to compete with incredible results from Q3 2021. Nvidia is a stock I’m betting against, and U.S. regulations aren’t on their side, but the same concepts apply to many stocks. I wonder how much longer Amazon can have a P/E above 100 in this economic environment.
Stocks will come down to compensate for elevated P/E ratios and discouraging market sentiment. While the P/E ratio isn’t everything, P/S ratios should also face challenges as companies report lower top-line growth. Many companies got away with high valuations because of substantial top and bottom line growth. Investors have more patience for rapidly growing companies in good economic times, but any cracks in the growth narrative can send highly valued companies spiraling. Peloton is an excellent example of this dynamic. The stock has crashed over 90% from its all-time high due to structural issues within the business model.
How I’m Approaching Current Market Sentiment
I haven’t invested in several months and have several long-term puts (expiration dates are a few months away), primarily on Nvidia, QQQ, and a few other tech stocks.
You can look at many data points to draw the conclusion you want, but two questions can help you get a gauge for the stock market’s future performance:
How is the consumer doing?
How are businesses doing?
Consumer spending makes up 70% of GDP. Businesses need consumers to spend money in order to report record breaking profits. When consumers cut their spending or can’t keep up with debt, businesses suffer. Those companies must then lay off some of their staff to protect profits and compensate for less revenue.
Pay attention to how consumers and businesses are performing. They dictate how the stock market will perform.