
Why Pandas itertuples() Is Faster Than iterrows() and How To Make It Even Faster

Introduction
In this article, I will explain why pandas’ itertuples() function is faster than iterrows(). More importantly, I will share the tools and techniques I used to uncover the source of the bottleneck in iterrows(). By the end of this article, you will be equipped with the basic tools to profile and optimize your Python code.
The code to reproduce the results described in this article is available here. I assume the reader has a decent amount of experience writing Python code for production use.
Motivation
Imagine you are in this scenario:
You are a data scientist tasked with building a web API to classify whether a picture contains a cat given a batch of images. You decide to use Django to build the API component and to keep things simple, embed the image classifier code in in the same codebase too. You spend a couple of weeks working on this project only to find that your web app is too slow for production use. You consult your colleague who is a software engineer for advice. That colleague tells you that Python is slow and that for anything API-related, Go is the tool of choice.
Do you rewrite everything in Go (including learning a new web framework) or do you try to systematically identify what is causing your Python code to run slowly?
I’ve seen many data scientists who favour the former option despite a very steep learning curve because they do not know how to troubleshoot their code’s running time. I hope this article will change that and will stop people from needlessly abandoning Python.
Problem Statement
To make things more concrete, we will use this scenario as a running example for the rest of this article:
You’d like to populate the content of a container based on the content of a dataframe. For simplicity, let the container be a dictionary keeping track of the count of observations in the dataframe. For example, if this is the dataframe you are given:
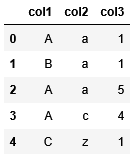
then the content of the dictionary will look like this:

The dictionary’s key can be a tuple of (col1, col2) or another dictionary where the first key is col1 and the second key is col2. The exact implementation details don’t matter. The point here is that you want a dictionary that tracks the count of all possible pairs in col1 and col2.
Solution
Iterrows() Solution
Here’s what an iterrows() solution would look like given the problem statement described in the preceding section:
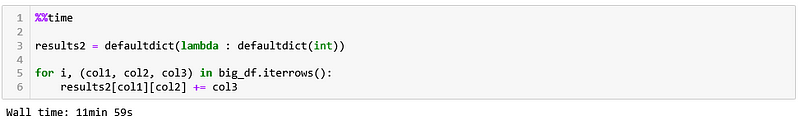
big_df is a data frame whose content is similar to Figure 1 except that it has 3 million rows instead of 5.
On my machine, this solution took almost 12 minutes to execute.
Itertuples() Solution
Here’s what an itertuples() solution would like:
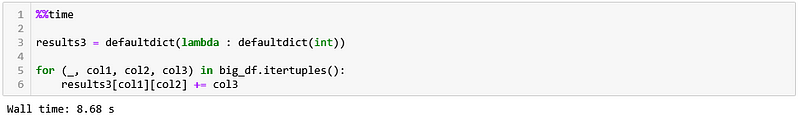
This solution only took 8.68 seconds to execute which is about 83x faster compared to the iterrows() solution.
Analysis
So why is itertuples() so much faster compared to iterrows() ?
The starting point to understand the difference in speed is to run these solutions through a profiler. A profiler is a tool that will execute a given code while keeping track the number of times each function is called and its execution time. That way, you can start your optimization process by focussing your attention on the function(s) that consume the most time.
Python comes with a built-in profiler that can be conveniently called from a Jupyter notebook using the %%prun cell magic.
Let’s reduce big_df to just 1,000 rows and look at what are the top 10 functions that took the most time to execute in total under each solution. Here are the results:
There’s a lot of information to unpack here so for brevity, I will focus on the parts that are relevant to our problem, starting with Figure 5. I encourage the reader to read the profile module’s documentation to understand what the rest of the output means.
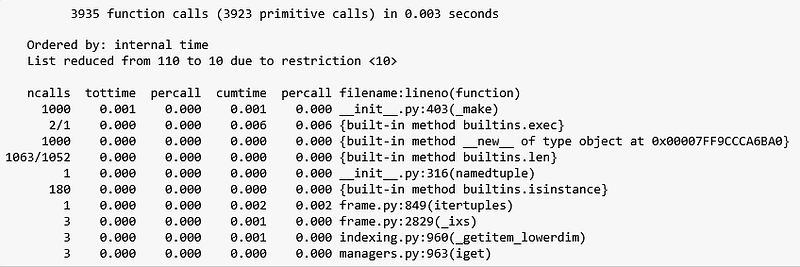
According to Figure 5, the itertuples() solution made 3,935 function calls in 0.003 seconds to process 1,000 rows. The function that took up the most execution time was _make which was called 1,000 times, consuming 0.001 seconds of the execution time. This function belongs to the collections module and is defined here.
_make just creates a tuple out of an iterable and since we have 1,000 rows, it makes sense that this function gets called 1,000 times (the iterable in each call being a row in our dataframe). Noting that the total time that this solution took is 0.003 seconds and rest of the functions took 0 seconds, let’s proceed to analyzing the output in Figure 6.
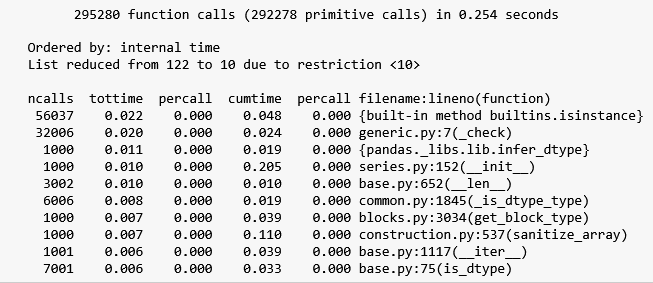
Figure 6 shows that the iterrows() solution made 295,280 function calls in 0.254 seconds. Compared to the itertuples() solution, all top 10 functions in the iterrows() solution have non-zero tottime values. Moreover, the actual call to iterrows() is not even in the list of 10 top functions that took the longest to execute. In contrast, the call to itertuples() in the itertuples() solution is ranked at position 7 in Figure 5.
This suggests that there is a lot of overhead associated with the call to iterrows(). Looking at the list of functions being called, we see that these overhead pertains to type checking code, e.g. is_instance and _check in the first and second row respectively. You can verify that this is the case by manually stepping through an execution of iterrows() using a debugger.
So there you have it. The reason iterrows() is slower than itertuples() is due to iterrows() doing a lot of type checks in the lifetime of its call. Now let’s see what we can do with this insight.
Application: Building A Faster Solution
Suppose we didn’t know the function itertuples() exists. What can we do to improve the row iteration performance? Well, in the preceding section, we have identified that the bottleneck is due to excessive type checking so a good first attempt at a solution is to create a data structure that does not do type checks. Here’s an example:
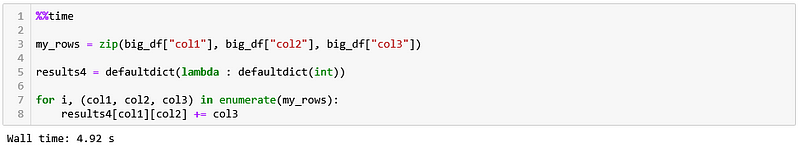
Line 3 of Figure 7 shows that we create our rows to iterate over by simply zipping the relevant columns. This solution only took 5 seconds to execute over 3 million rows, which is almost twice as fast as the itertuples() solution. Let’s call our solution the custom solution and profile it to see if we can identify the source of the speedup.
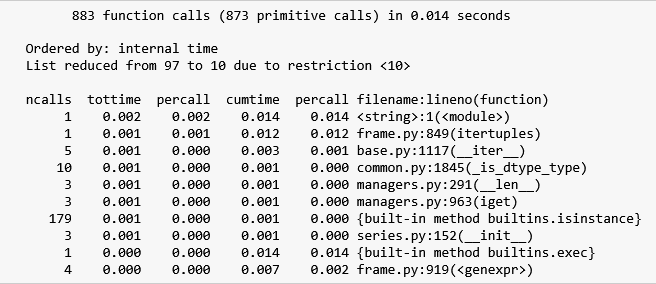
Here’s the top 10 functions that took the most time to execute in our custom solution on a dataframe of 1,000 rows:
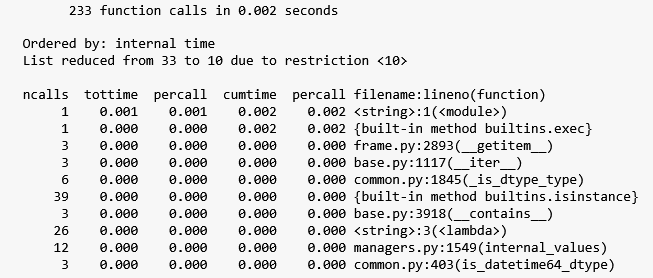
What is striking about Figure 8 is that it shows the custom solution only made 233 function calls in 0.002 seconds. This is surprising to me since I expected at least 1,000 calls since we are still iterating over 1,000 rows.
Let’s see which function is called the most by sorting the ncalls column in descending order:
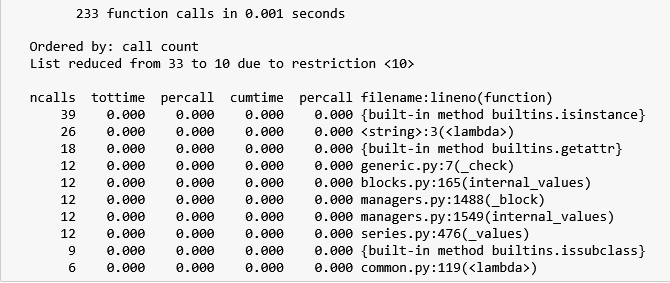
Figure 9 shows that the most called function is isinstance which was called only 39 times. This still does not provide any useful information to figure out how the iteration was done with a total of less 1,000 function calls.
Another useful profiling technique is to profile the lines of our code i.e. see how many times each line is executed and how long it took. Jupyter has a line magic called %lprun which comes with the line_profile package.
Here’s what the line profile looks like for our custom solution:
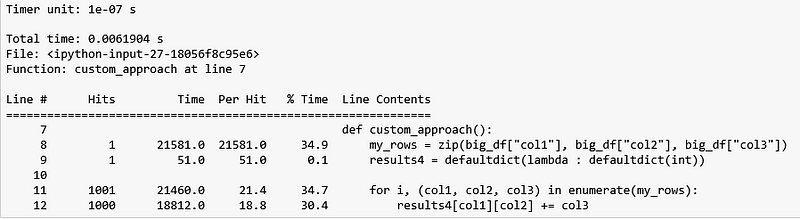
As expected, we see that the iteration does happen 1,000 times (line 12). This suggests that iterating n rows does necessarily mean having to call a function n times. So the next logical question to ask is: Who is calling _make in Figure 5 1,000 times and is there any way we can avoid/reduce the number calls?
Fortunately for us, Python comes with a pstats module that allows us to dig deeper into the output of a function profile run. I refer the reader to the code accompanying this article for details on how to get this information. Anyway, here’s all the functions that called _make :
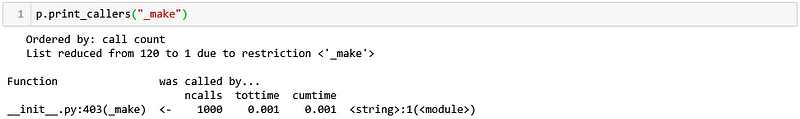
In this case, the output is not useful at all (<string:1(<module>)refers to the top-level code for the “script” passed to the profiler, which is the content of the entire cell implementing the itertuples() solution).
Another approach to figure out who is calling _make is by inserting a breakpoint inside _make and then executing the solution inside a debugger. When the breakpoint is hit, we can trace the frames to see the chain of calls that led to _make .
Doing so reveals that the 1,000 calls to _make originate from the call to itertuples() itself, as shown here. The following figure shows the most interesting part of itertuples() :
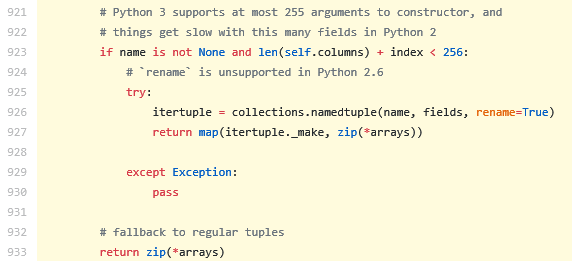
Figure 12 shows that there are 1,000 calls to _make because line 927 returns a map that basically calls _make for each row in the dataframe. The interesting part of this snippet is that the call to map is nested under an if statement where one of the condition is that the name parameter in itertuples() must not be None . If it is, then it will return an iterator that iterates over the zipped columns in the dataframe … which is the same thing as what our custom solution does!
The documentation of itertuples() says that if the name parameter is a string, then it will return named tuples with the given name . If name is None , then it will return regular tuples instead. Our code will work just as well regardless of itertuples() ’s return type. So let’s prefer regular tuples over named tuples so that we can skip the 1,000 calls to _make . This is what happens when we set the name parameter in itertuples() to None :

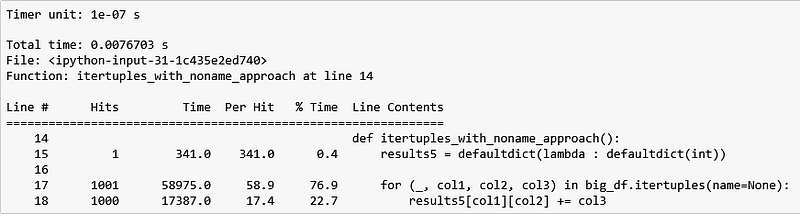
The itertuples(name=None) solution is competitive with our custom solution. It took 5.18 seconds to iterate over 3 million rows whereas our custom solution only took 4.92 seconds.
Conclusion
This article has shown the reader how to use a Jupyter Notebook to:
- Figure out which function calls are taking the most time to execute, and
- Which lines in a code snippet is taking the most time to execute
It also has illustrated the need to be adept with using a debugger to step through code and reading documentation to identify optimization opportunities.
I hope you will consider applying the techniques described in this article the next time you face “slow” Python code. Let me know in the comments if you have any questions.


