
Why I’m concerned about the coronavirus: applying viral growth data metrics to a growing crisis
“We can’t predict when, but given the continual emergence of new pathogens, the increasing risk of a bioterror attack, and the ever-increasing connectedness of our world, there is a significant probability that a large and lethal modern-day pandemic will occur in our lifetime.” — Bill Gates
Coronavirus (2019-nCoV) has been grabbing headlines and generating justifiable fear and caution worldwide over the past month. The concern is well-founded. In an effort to collect my thoughts and make sense of the (often conflicting) information, I wanted to apply what I’ve read so far about 2019-nCoV to a framework that’s familiar to me.
I have spent 20 years working with viral growth data metrics as they relate to the consumer internet, and applying these concepts to the spread of 2019-nCoV has been helpful for me as I think through the best ways to protect my family. I want to stress that my area of expertise is not in virology, epidemiology, or medicine. I am sharing my thoughts more widely in case it helps anyone else make sense of the current spread of 2019-nCoV.
The most common response I get when I ask my friends if they are concerned about the 2019 novel coronavirus is: “Don’t worry about the coronavirus. You are much more likely to die of the flu.”
They are correct that the flu poses a much larger risk to myself and my family today than 2019-nCoV. According to the CDC, tens of thousands of Americans die from the flu every year. And so far, there have only been 12 diagnosed cases of 2019-nCoV in the U.S. and not a single death.
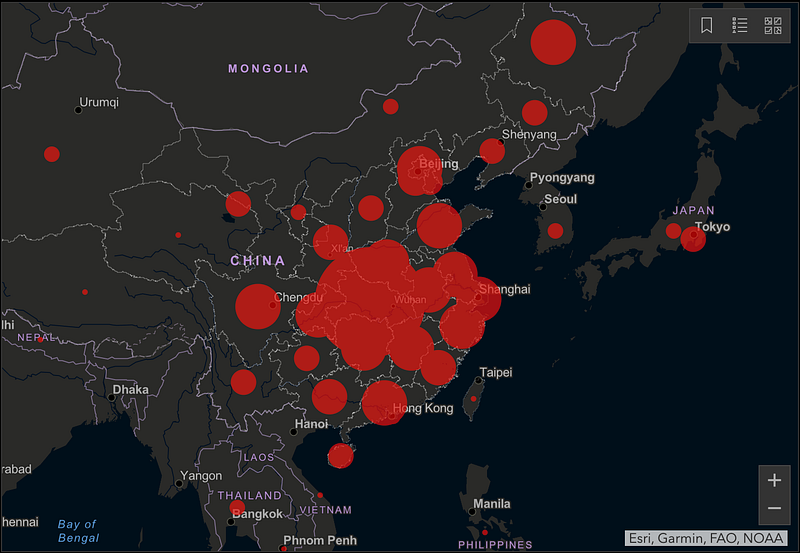
However, watching the early spread of this coronavirus that originated just over two months ago in Wuhan, China is the first time I’ve been afraid that the world could be facing a pandemic at a scale similar to the Spanish flu of 1918, which infected one third of the world’s population and killed tens of millions of people.
Why am I so concerned? It all boils down to two simple numbers: the reproduction number (R0) and the case fatality rate (CFR). For the flu, R0 is 1.3 and CFR is 0.1%. For 2019-nCoV, experts currently estimate R0 to be ~2.6 (2x the flu) and CFR to be ~1.5% (15x the flu). If we are not able to reduce these numbers quickly and drastically, 2019-nCoV could become a pandemic that infects over 1 billion people and results in over 10 million deaths.
Reproduction number (R0)
R0 (also known as the “k-factor” among growth experts) is the reproduction number of the virus. It is the average number of people who will get infected by each individual who already has the virus. For example, if R0 is 2, then 1 person will infect 2, who then infect 4, who then infect 8, etc. Viral growth is binary and extremely sensitive around an R0 of 1. If R0 > 1, growth is exponential. If R0 < 1, growth quickly abates.
It is too early to know the exact R0 of 2019-nCoV, but Professor Neil Ferguson at Imperial College London estimates it to be somewhere between 2.1 and 3.3. Even the low end of this range is extremely high. To put things in context, I once built a Facebook app called Send Hotness that had an R0 of 1.4. It grew exponentially from 1 to 5,000,000 users in 5 weeks.
R0 is driven by three main variables:
R0 = transmission risk (p) x contact rate (γ) x duration (D)
Reducing any of the three variables above (p, γ, and D) will lower R0. For example, if people wear face masks and wash their hands more frequently, that would lower the transmission risk (p). If people do not spend as much time in groups or self-quarantine at home, that would lower the contact rate (γ). And if infected people get diagnosed early and receive medical care as soon as possible, that would reduce duration (D). All of these behavioral changes will lower R0. However, the difficulty with starting at a high initial value of R0 is that you have to work extra hard to get it below the magic threshold of 1.
An additional challenge to lowering the R0 of 2019-nCoV appears to be asymptomatic transmission. According to a team of Japanese university researchers at Hokkaido University, half of secondary virus infections occur during the incubation period. What are the implications of this? Even if all secondary infections were to be prevented after the incubation period (i.e. once symptoms appear), R0 would be reduced by only 50% (i.e. from 2.6 to 1.3). If the resulting number is still above 1.0, the virus will not be contained.
Case fatality rate (CFR)
Case fatality rate is the percentage of confirmed cases who ultimately die of the virus. Experts say it is still too early to estimate the CFR of 2019-nCoV. This study from the University of Bern, Switzerland estimates CFR outside of China to be 1.5% (however, the 95% confidence interval is quite wide at 0.1%-6.6%). While in the middle of an epidemic, you cannot just divide the total number of deaths by the total number of cases to calculate CFR, since most cases are still unresolved, as you can see in the chart below:
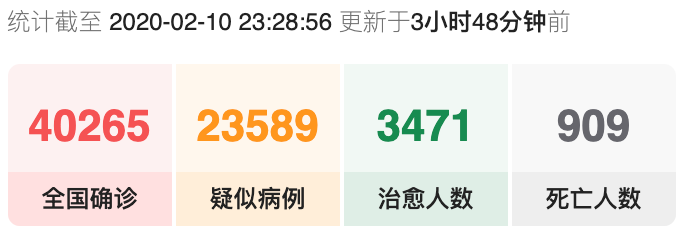
One way to estimate CFR in the middle of an epidemic, as this study from the American Journal of Epidemiology points out, is:
CFR = deaths / (deaths + recoveries)
Plugging the above (green and grey) numbers into this equation results in a CFR of 21%, but this number is likely significantly overstated, given that a large number of cases in China are not reported or confirmed.
Even if the CFR of 2019-nCoV ends up being a fraction of that of SARS (11%) or MERS (39%), it could become a devastating pandemic if we are not able to contain it by reducing R0 to a number below 1. All else equal, a virus with twice the fatality rate will kill twice as many people, but a virus with twice the reproduction number could end up killing 1000 times as many people.
2019-nCoV vs. SARS-CoV
In its first six weeks, 2019-nCoV has killed more people than SARS did during its entire 9-month outbreak. SARS had an R0 of 3 and a CFR of 11%, yet it was contained when control measures reduced the R0 to 0.4. The fact that 2019-nCoV is spreading much more quickly than SARS almost two decades later indicates that something significant is different this time. Perhaps the biggest difference with 2019-nCoV is asymptomatic transmission. SARS was only contagious after symptoms (including fever) were present. This made it possible to rapidly screen people who might have the virus and immediately lower R0 as a result. However, according to the Hokkaido University study as well as this Taiwanese epidemiologist, 2019-nCoV is highly contagious even before symptoms are present, making containment much more challenging. This may be why China is currently resorting to mass quarantines. If the “asymptomatic R0” of 2019-nCoV is above 1, a single undetected person is all it would take to start a new outbreak.
It was just two months ago that this new coronavirus was discovered in Wuhan. Today, 60 million people are quarantined in China, new hospitals have been built in record time to handle the surge in severe cases, and the virus has now made its way to at least 27 countries outside of China.
The next two months will be critical, and it is important for all of us to do everything in our power to minimize viral spread. The simple stuff includes washing hands more frequently, greeting others without handshakes, getting a flu shot (if you haven’t already), and cleaning and disinfecting frequently touched objects. All of these actions are recommended by the CDC. Hopefully, through behavioral changes such as these, we will be able to keep R0 below 1 and prevent this virus from becoming a pandemic. If not, we may have no choice but to take more extreme measures, such as self-quarantining in our homes for an extended period of time.
I want to end by taking a moment to acknowledge all of the suffering and heroism that is currently going on in the quarantine areas in China. Families are being separated and many loved ones are dying. Nurses and doctors such as Dr. Peng Zhiyong are working eight hour and 12 hour shifts without food, water, or bathroom breaks in order to avoid changing their protective gear mid-shift given the shortages. Our hearts are with all of you during this crisis.
My hope is that by working together and sharing information across borders, we will collectively defeat this virus. Everything we do now will not only help us with this outbreak, but will also help us be more prepared for future ones.
武汉加油! 中国加油!
Be strong, Wuhan! Be strong, China!