
Who Makes the Rollercoaster Ride of Global House Prices in 2020–2023?
[This article summarizes my published paper at Urban Science: Yiu, C.Y. (2023) Are Central Banks’ Monetary Policies the Future of Housing Affordability Solutions? Urban Science, 7, 18. https:// doi.org/10.3390/urbansci7010018]
A Rollercoaster Ride of Global Real House Prices
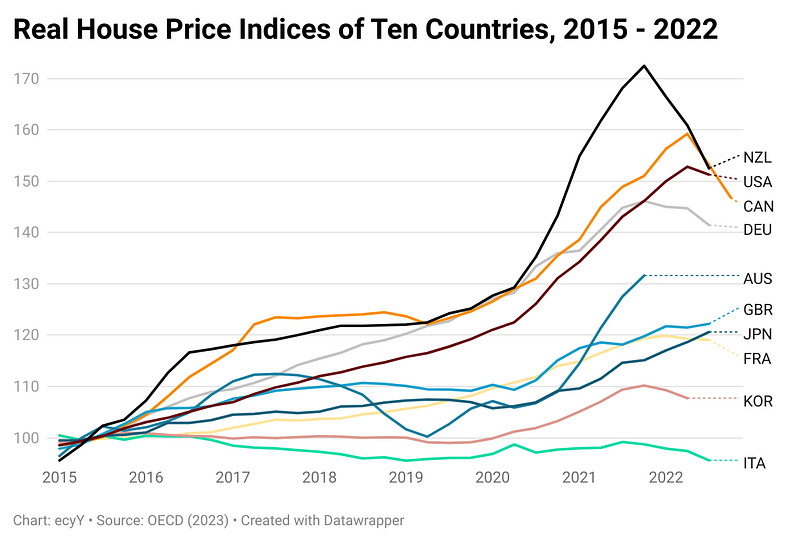
We are experiencing a rollercoaster ride of global real house prices. Figure 1 shows how exciting the rollercoaster is. Take New Zealand (NZL) as an example, the real house price index climbed up rapidly from 127.7 in 2020 and peaked at 172.5 in 2021. It is a 35% increase in real house price in just about 2 years! Then it sloped down like an avalanche, and it has fallen by 11.6% in three quarters. Many other countries real house prices follow a similar ride, the top four most exciting rides are NZL, Canada (CAN), USA and Germany (DEU). Who makes the global house prices a rollercoaster ride?
A Synchronized Global Cause
It is interesting to have such a synchronized global house price movements, it is unlikely to be caused by some internal factors of individual countries, such as housing supply, as it is not plausible to have a global insufficient housing supply in 2020 and then a global oversupply of housing in 2022, especially when the global supply chains of construction materials have been severely disrupted during the pandemic period.
Similarly, it is also implausible to explain the surges and falls in real house prices by say a change in demand for bigger homes due to the pandemic, as such a change in housing preference is continuing in 2022. All these reasons can either explain a surge or a fall in a few countries, but not both in many countries within 2 years.
The cause of the rollercoaster rides must be some synchronized actions taken by many countries almost at the same time and the concerted actions must involve a synchronized switch (such as switching up and down) in this period so as to make the global real house prices rise and fall. What is the culprit?
Empirical Evidence of the Causes
This study exploits the COVID-19 pandemic period as quasi-experiment to investigate the cause of the global house price changes. The results show prima facie evidence that monetary policy is the cause of the rollercoaster ride.
Global Expansionary Monetary Policy in 2020–2021
With the outbreak of the COVID-19 pandemic in the early 2020, “… central banks ‘implemented unparalleled monetary policies, ultimately lowering their policy rates to historically depressed levels, even below zero’ [37]. … In 2020 Q1, there were 73 interest rate cuts by 54 central banks to support the economies. Some central banks also relaxed liquidity rules on banks, such as the removal of the loan-to-value ratio restrictions on new mortgages in New Zealand. The global financial markets were flooded with liquidity in this period.” (Yiu, 2023, p.2)
Global Contractionary Monetary Policy since 2022
“However, in the wake of the Russian–Ukraine war since February 2022, many central banks started increasing interest rates and turned the accommodative monetary policy into a contractionary one. In 2022 Q2, 55 central banks around the world turned around to raise interest rates 62 times, each time not less than 50 basis points [39]. In the first three quarters of 2022, the world recorded a total of 8190 basis points in central bank interest rate hikes, and just counting the G10 countries alone, their central banks raised interest rates by a total of 1850 basis points [40].” (Yiu, 2023, p.3)
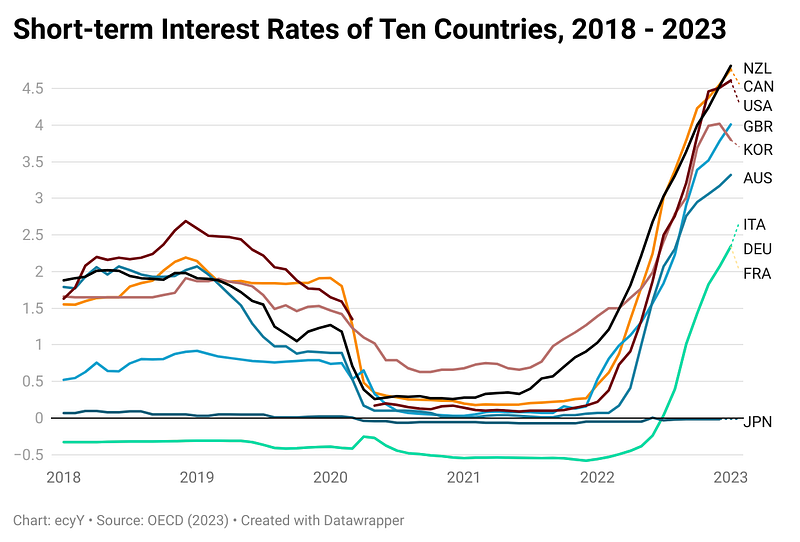
Figure 2 shows vividly the concerted efforts of central banks in cutting interest rates in the early 2020 and raising interest rates in 2022. The timing of the switching actions coincide exactly with the rise and fall of real house prices in the world. They show a negative association between interest rate and real house prices. Since the actions are contrarian for the purposes of saving the economy in 2020 and dampening the inflation in 2022, the economic conditions can further reinforce the conclusions, as the house prices surged at the time of a global recession due to the pandemic, and the house prices fell at the time of a global inflation due to the Russian–Ukraine war.
The study further conducts several cross-country panel regression analyses, which confirm the hypothesis that real interest rate is a major cause of house price changes, ceteris paribus. With the temporal precedence and counterfactual dependence, this study is the first one using quasi-experiment to show the causation relationship of real interest rate change on house price change. For more information of the empirical results and the implications, please refer to Yiu (2023) which is open access for all.


