When the NYMO warns the NYSI could turn and take the market with it, up or down — 10/30/2023
The stock market either goes up or goes down, taking its stocks and ETFs with it. And yet It is amazing how difficult it is to recognize that simplicity.
THE TRADING STRATEGY
Short-term swing trading: When the NYMO turns up, it is time to buy stocks on the next open. When the NYMO turns down it is time to sell stocks on the next open.
Longer-term swing trading: When the NYSI turns up it is time to buy stocks on the next open. When the NYSI turns down, it is time to go to cash or to go short on the next open.
Most stocks and ETFs move with the market.
Simple as that.
Once up a time…
…well, actually almost every time one of the great things about the NYMO (the NYSE short-term breadth indicator) is it warns ahead of time when the longer-term breadth indicator, the NYSI, might be going to turn the general market up or down for a bigger rally, or a bigger sell off.
THIS may be one of those times…
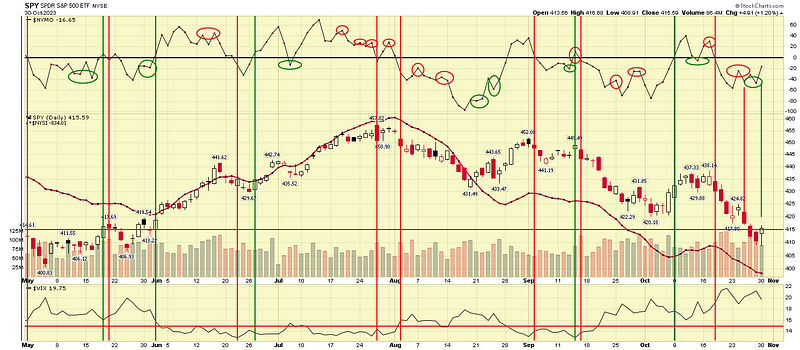
See the chart below — the red circles show the lows above lows and high below highs on NYMO, the colored vertical lines show the NYSI turns that so often follow.
In this case, the possible move is a swing to the upside, reversing current market drop.
(CLICK ON THE CHART FOR A LARGER VIEW.)
Why does this matter?
Well, if a swing trader is holding considerable profits as a result of the NYSI’s timing the market’ current sell off, that trader might want to take some of those profits off the board, or at least tighten stops to preserve some of the profits in case the turn comes.
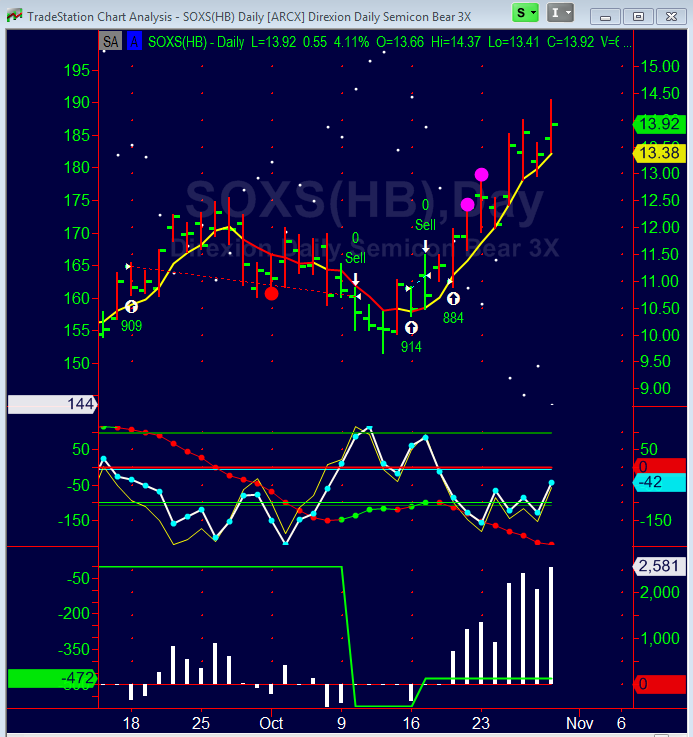
For examples, let’s take a look at three of the 3x-leveraged bearish ETFs I’ve suggested as convenient vehicles to drive the market’s down-hill slide.
(The red bars on the chart are color-coding for a declining NYSI, the green for a rising NYSI.)
SOXS — the bearish semi-conductor sector ETF is, on today’s close, is up 25.8% in the eight trading days the NYSI has been on a sell signal.
(The white flag on the charts right axis shows the gain for each $10K put in the trade. Click on the chart for a larger view.)
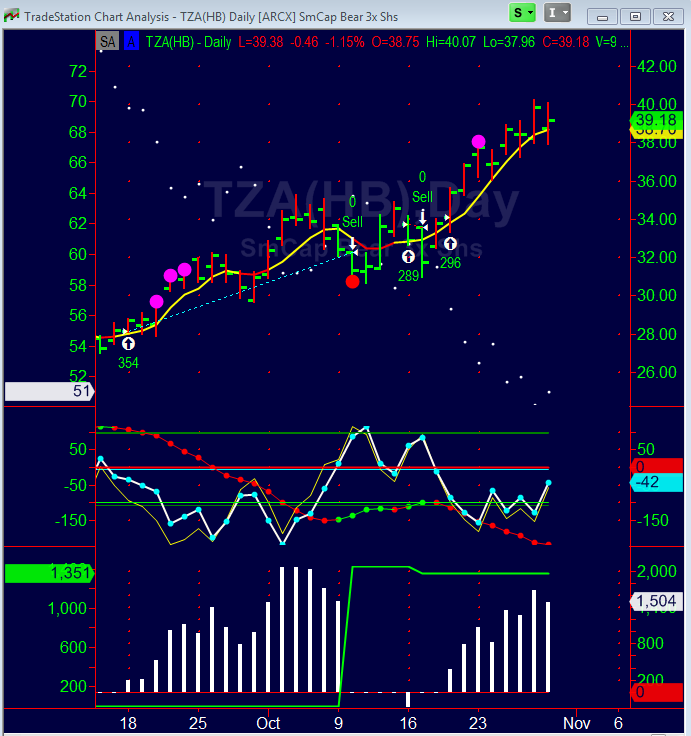
TZA — the leveraged ETF for the small-cap Russell stocks is up 15% in eight trading days.
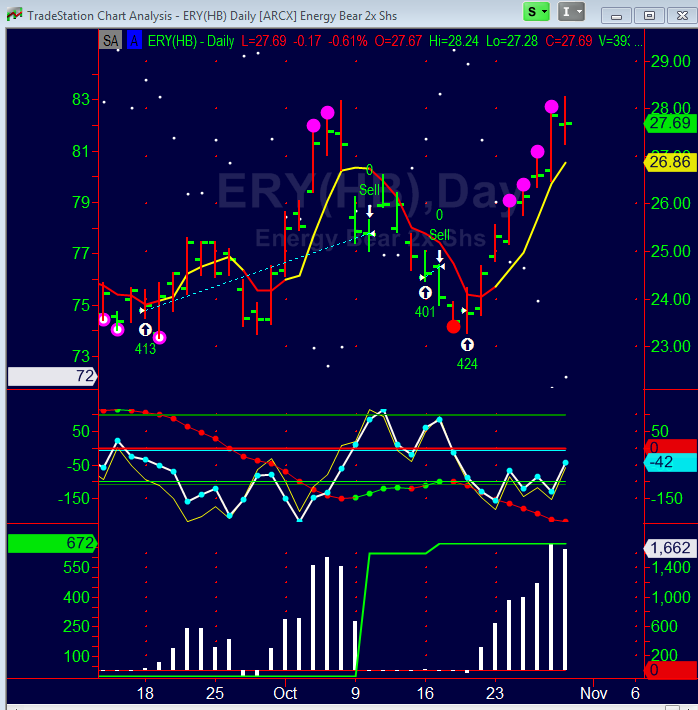
ERY — and even the energy sector (oil, oil, oil…) have plummeted in the face of a falling NYSI with its leveraged ETF up 16.6% for the eight trading day.
The NYSI may not turn tomorrow, and one can wait for the actually turn, but just in case the NYMO is right now fore warning.
A Message from InsiderFinance

Thanks for being a part of our community! Before you go:
- 👏 Clap for the story and follow the author 👉
- 📰 View more content in the InsiderFinance Wire
- 📚 Take our FREE Masterclass
- 📈 Discover Powerful Trading Tools