st issue a front developer can face, but luckily the framework handles this in our case. Now we need to load the exported chat file and run the analysis.</p><h1 id="4d9b">Data flow</h1><p id="f4a5">Streamlit's architecture allows us to write apps like we write python scripts. To render any update on the screen Streamlit runs the python script from top to bottom. Whenever we interact with any button on the screen or give any input, Streamlit runs the whole python script from top to bottom.</p><p id="a12d">You may think this is a tedious process for longer scripts. Yes, it is! but this is where Streamlit does some heavy lifting for us behind the scenes. A big player <code>st.cache()</code> decorator comes into the picture. This allows the app to skip certain costly computations (whose outputs are not changed)when the app reruns.</p><h1 id="58d9">Widgets</h1><p id="1659">When you’ve got the data into the state that you want to explore, you can add in widgets like <a href="https://docs.streamlit.io/en/stable/api.html#streamlit.slider"><code>st.slide</code>r()</a>, <a href="https://docs.streamlit.io/en/stable/api.html#streamlit.button"><code>st.butto</code>n()</a> or <a href="https://docs.streamlit.io/en/stable/api.html#streamlit.selectbox"><code>st.selectbo</code>x()</a>. It’s really straightforward — just treat widgets as variables:</p><p id="fe1b">In our chat analysis app, we will be using two widgets. One to upload the chat file and another to filter the stats based on user input.</p><div id="600b"><pre><span class="hljs-attr">uploaded_file</span> = st.file_uploader(<span class="hljs-string">"Upload Your Whatsapp Chat.(.txt file only!)"</span>, type=<span class="hljs-string">"txt"</span>)</pre></div><p id="02d1">This will create a file uploader and will only accept files of type <code>.txt</code> .The first argument is the heading of this file uploader.</p><figure id="5355"><img src="https://cdn-images-1.readmedium.com/v2/resize:fit:800/1*Lq_pbXhvBelnxZ7kdAsHbw.png"><figcaption></figcaption></figure><p id="a8b8">Clicking on <b>browse files </b>will direct us to the local system and we must upload a <code>.txt</code> file.</p><p id="6cab">The <code>.txt</code> file is a text file that consists of the exported WhatsApp chat. As discussed in my previous article we will parse the text, split it into Date, Time, Author, Message categories, and create a data frame. We will also clean the data frame by removing the missing values and also perform appropriate type conversions (ie. convert date string to date-time format, etc.). After this, we can filter the data frame as required and create plots.</p><p id="364e">Since I used Plotly for visualization, we can create plots using the function <code>st.plotly_chart(fig)</code> to create Plotly figures. For example, to create an emoji distribution chart we will write a function <code>visualize_emoji()</code> that will create a Plotly figure by filtering the data frame and returns the figure.</p>
<figure id="ab20">
<div>
<div>
<iframe class="gist-iframe" src="/gist/kurasaiteja/e5acefc218b28f524cd3881d356ebee0.js" allowfullscreen="" frameborder="0" height="undefined" width="undefined">
</div>
</div>
</figure></iframe></div></div></figure><p id="32f7">Now we can draw the plot using the following code.</p><div id="9952"><pre><span class="hljs-keyword">st</span>.subheader(<span class="hljs-string">"**%s's emoji distribution 😂**"</span>% name)
<span class="hljs-keyword">st</span>.text(<span class="hljs-string">"Hover on Chart to see details."</span>)
<span class="hljs-keyword">st</span>.plotly_chart(visualize_emoji(data),use_container_width=True)</pre></div><p id="6489">Here name indicates the individual name or group.</p><h2 id="d1c6">Output -</h2><figure id="c67c"><img src="https://cdn-images-1.readmedium.com/v2/resize:fit:800/1*uvtP_pPwwMHXdTAg30LbCA.png"><fi
Options
gcaption></figcaption></figure><p id="24a5">Similarly, all the plots mentioned in the previous article are created. Another feature included in the web app is the ability to filter stats based on users. We provide a dropdown and ask the user to select a particular user whose individual stats will be displayed.</p><p id="ca73">To create a dropdown we will use the <code>st.selectbox()</code> command. We will pass a list consisting of unique authors and an option “all”(for the whole group stats) to the <code>st.selectbox()</code> command. The user-selected option is stored in a variable called <b>option</b> and this variable is used to filter the stats in the data frame.</p><div id="c5bf"><pre>authorlist = <span class="hljs-built_in">list</span>(data<span class="hljs-selector-class">.Author</span><span class="hljs-selector-class">.unique</span>())
authorlist<span class="hljs-selector-class">.insert</span>(<span class="hljs-number">0</span>,<span class="hljs-string">'All'</span>)
st<span class="hljs-selector-class">.subheader</span>(<span class="hljs-string">"Who's Stats do you want to see?"</span>)
option = st<span class="hljs-selector-class">.selectbox</span>(<span class="hljs-string">""</span>, authorlist)</pre></div><figure id="2c36"><img src="https://cdn-images-1.readmedium.com/v2/resize:fit:800/1*veitRRoOdgt1Por5N5roFw.png"><figcaption></figcaption></figure><figure id="d377"><img src="https://cdn-images-1.readmedium.com/v2/resize:fit:800/1*9N2pmdua7W4XFrJI-Te5qw.png"><figcaption></figcaption></figure><h1 id="06d7">st.cache()</h1><p id="58ad">As I already mentioned, whenever we give a new input Streamlit runs the python script from top to bottom. In our case when we select one user from the dropdown, Streamlit runs the whole script which includes opening the file, parsing the file, creating the data frame, and applying filtering.</p><p id="40bf">This is not an optimal way, because filtering requires only the data frame and parsing the data every time, and creating the data frame again when we click on each user is not appropriate. Hence we will use the st.cache() command along with the <code>load_data()</code> function. This will ensure that the second time <code>load_data()</code> function is run, it’s results will be directly fetched from the cache instead of re-running the function. This increases the speed of the application and enhances performance.</p><div id="dcc3"><pre><span class="hljs-meta">@st.cache(<span class="hljs-params">allow_output_mutation=<span class="hljs-literal">True</span></span>)</span>
<span class="hljs-comment"># This function parses the text file and creates the data frame.</span>
<span class="hljs-keyword">def</span> <span class="hljs-title function_">load_data</span>(<span class="hljs-params">uploaded_file</span>):
.....function body</pre></div><h1 id="48ef">Deployment using Heroku</h1><p id="b6b9"><b>Heroku</b> is a platform as a service (PaaS) that enables developers to build, run, and operate applications entirely in the cloud. We will deploy our web app to Heroku. This is a short and simple process which is very well explained in this <a href="https://towardsdatascience.com/deploy-streamlit-on-heroku-9c87798d2088">article</a>.</p><p id="966a">You can visit the fully running web application by clicking on the below link.
<a href="https://group-whatsapp-analyzer.herokuapp.com/">Whatsapp-Group-Chat-Analyzer</a>.</p><h1 id="c7ee">Conclusion</h1><p id="ae3b">In this article, I tried to explain the creation of a web app for a data science project using Streamlit. It is very important for data analysts to showcase their results and present them in a simple way to both technical/non-technical users. I hope you learned something new today!</p><p id="ec19">I hope you took home some new concepts today! If you would like to get in touch, <b>connect with me on <a href="https://www.linkedin.com/in/saiteja-kura-49803b13b/">LinkedIn</a>.</b></p></article></body>
Data Science, Programming
Analysing Whatsapp Group Chats using StreamLit— Part II
The journey of my application from a notebook to a web application using Streamlit and Heroku.
A screenshot the web app.
Don’t be satisfied with “almost” completing a task. Continue until you complete it.
In data science, it is important to work on real-time projects. It is equally important to share your work with the world which ensures that we receive constant feedback and can enhance the performance of our application. Jupyter Notebooks, Google Colab links are a good way to share our work. But in most cases, a client or the end-user is a person with minimal technical knowledge. How do you share your work with them?
A Web-App comes to the rescue! We can embed our analysis into a Web Application and share it with the outside world. Hence the load on the client reduces and it makes their work easier. Do read my previous article, to understand how we performed the data collection, cleaning, transforming, and visualization parts. In this article, I will talk about how I created a web application having minimal code using Streamlit.
What is Streamlit?
Streamlit is an open-source app framework with which we can create performant and beautiful web apps for Machine Learning and Data Science. Everything is written in pure python. Let us begin!
Make sure that you have Python 3.6 or greater installed.
That’s it! In the next few seconds, the sample app will open in a new tab in your default browser.
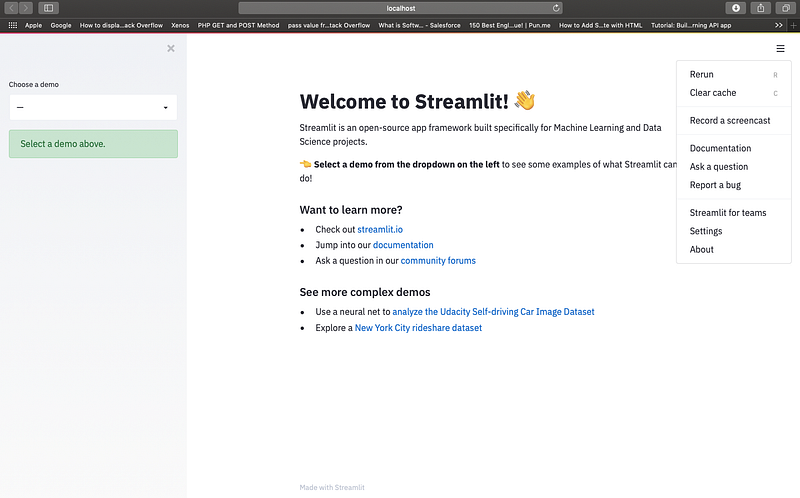
A default layout that looks simple and neat can be seen. To create our app let us create a new python script Whatsapp_Analysis.py and start writing the code!
Firstly we will import the required dependencies. Streamlit provides us some utility functions like st.text() , st.sidebar.text() , st.markdown(), etc.
We can embed HTML code in st.markdown() which ensures we can modify the UI.
The output —
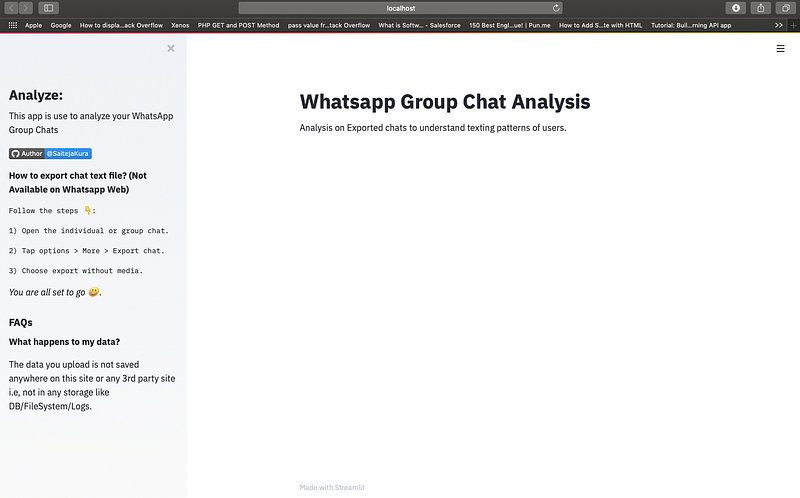
Surprisingly, 70% of the UI is completed with the above 10 lines of code. The above code is responsive too and when viewed on the mobile -
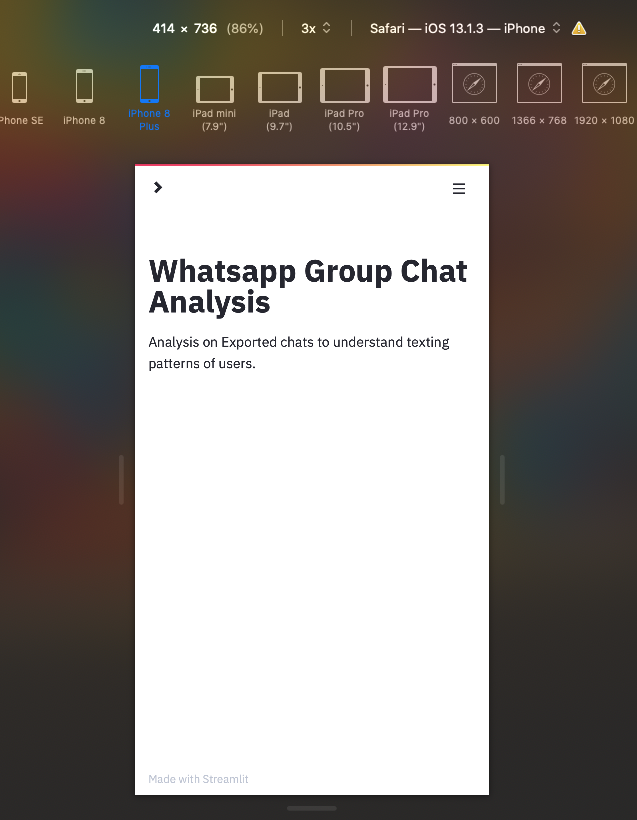
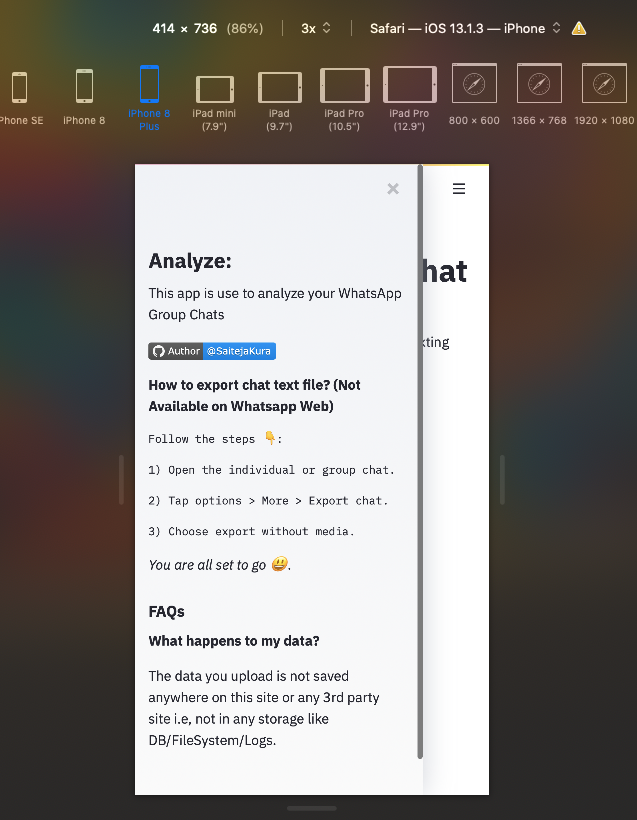
Making web apps responsive is the biggest issue a front developer can face, but luckily the framework handles this in our case. Now we need to load the exported chat file and run the analysis.
Data flow
Streamlit's architecture allows us to write apps like we write python scripts. To render any update on the screen Streamlit runs the python script from top to bottom. Whenever we interact with any button on the screen or give any input, Streamlit runs the whole python script from top to bottom.
You may think this is a tedious process for longer scripts. Yes, it is! but this is where Streamlit does some heavy lifting for us behind the scenes. A big player st.cache() decorator comes into the picture. This allows the app to skip certain costly computations (whose outputs are not changed)when the app reruns.
Widgets
When you’ve got the data into the state that you want to explore, you can add in widgets like st.slider(), st.button() or st.selectbox(). It’s really straightforward — just treat widgets as variables:
In our chat analysis app, we will be using two widgets. One to upload the chat file and another to filter the stats based on user input.
uploaded_file = st.file_uploader("Upload Your Whatsapp Chat.(.txt file only!)", type="txt")
This will create a file uploader and will only accept files of type .txt .The first argument is the heading of this file uploader.
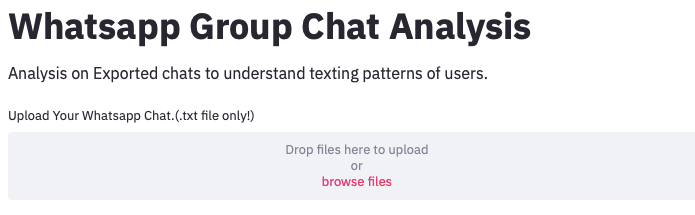
Clicking on browse files will direct us to the local system and we must upload a .txt file.
The .txt file is a text file that consists of the exported WhatsApp chat. As discussed in my previous article we will parse the text, split it into Date, Time, Author, Message categories, and create a data frame. We will also clean the data frame by removing the missing values and also perform appropriate type conversions (ie. convert date string to date-time format, etc.). After this, we can filter the data frame as required and create plots.
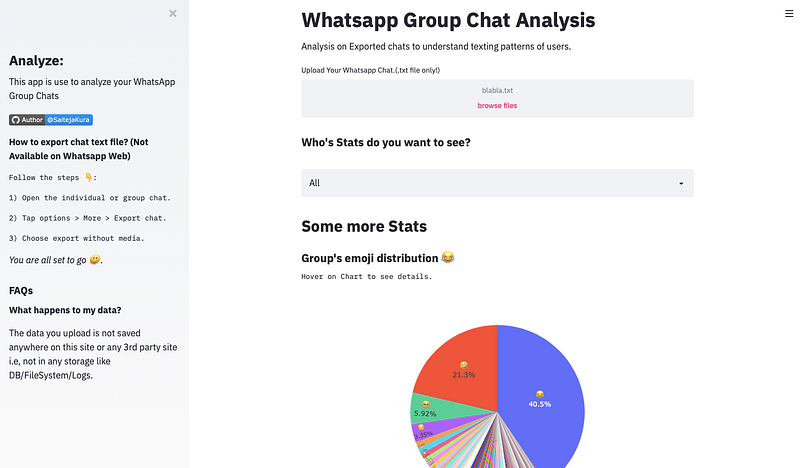
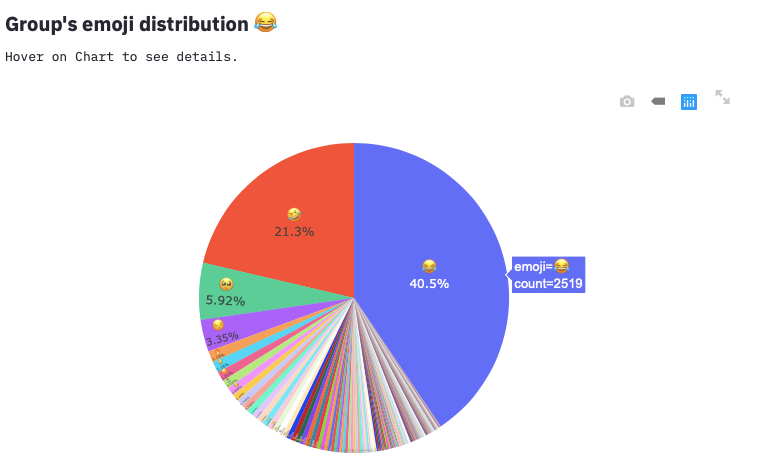
Since I used Plotly for visualization, we can create plots using the function st.plotly_chart(fig) to create Plotly figures. For example, to create an emoji distribution chart we will write a function visualize_emoji() that will create a Plotly figure by filtering the data frame and returns the figure.
Now we can draw the plot using the following code.
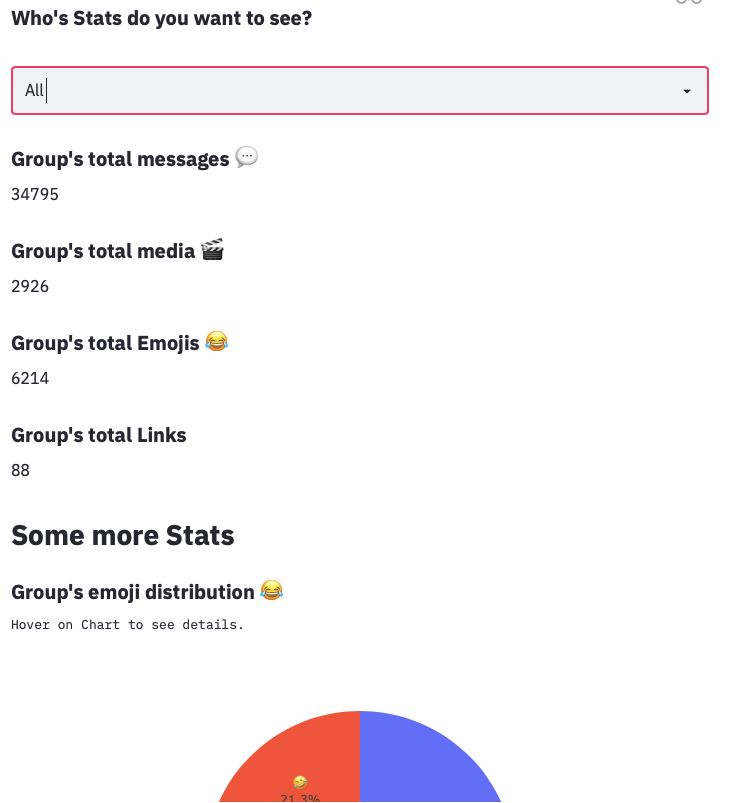
st.subheader("**%s's emoji distribution 😂**"% name)
st.text("Hover on Chart to see details.")
st.plotly_chart(visualize_emoji(data),use_container_width=True)
Here name indicates the individual name or group.
Output -
Similarly, all the plots mentioned in the previous article are created. Another feature included in the web app is the ability to filter stats based on users. We provide a dropdown and ask the user to select a particular user whose individual stats will be displayed.
To create a dropdown we will use the st.selectbox() command. We will pass a list consisting of unique authors and an option “all”(for the whole group stats) to the st.selectbox() command. The user-selected option is stored in a variable called option and this variable is used to filter the stats in the data frame.
authorlist = list(data.Author.unique())
authorlist.insert(0,'All')
st.subheader("**Who's Stats do you want to see?**")
option = st.selectbox("", authorlist)
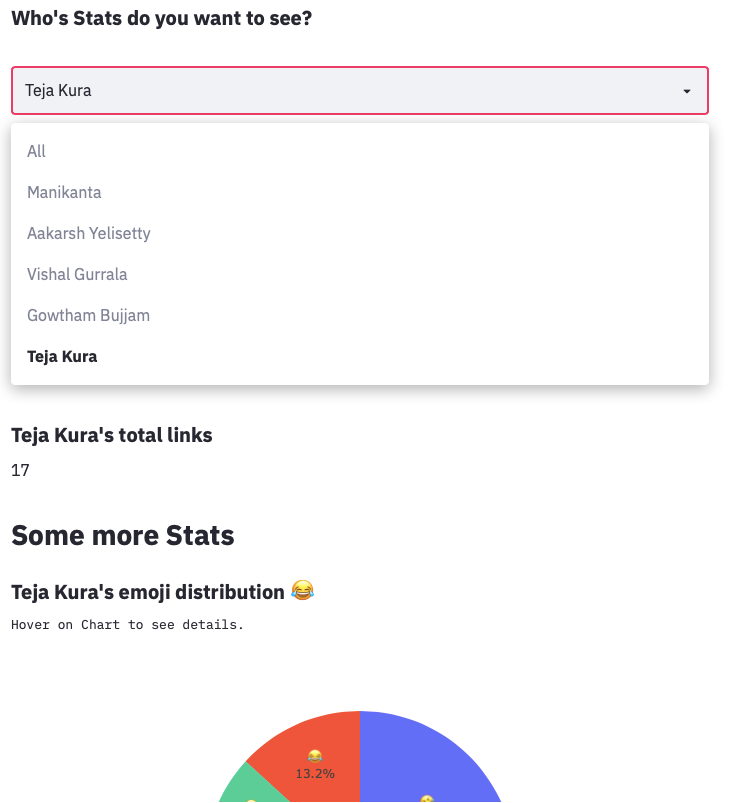
st.cache()
As I already mentioned, whenever we give a new input Streamlit runs the python script from top to bottom. In our case when we select one user from the dropdown, Streamlit runs the whole script which includes opening the file, parsing the file, creating the data frame, and applying filtering.
This is not an optimal way, because filtering requires only the data frame and parsing the data every time, and creating the data frame again when we click on each user is not appropriate. Hence we will use the st.cache() command along with the load_data() function. This will ensure that the second time load_data() function is run, it’s results will be directly fetched from the cache instead of re-running the function. This increases the speed of the application and enhances performance.
@st.cache(allow_output_mutation=True)# This function parses the text file and creates the data frame.defload_data(uploaded_file):
.....function body
Deployment using Heroku
Heroku is a platform as a service (PaaS) that enables developers to build, run, and operate applications entirely in the cloud. We will deploy our web app to Heroku. This is a short and simple process which is very well explained in this article.
In this article, I tried to explain the creation of a web app for a data science project using Streamlit. It is very important for data analysts to showcase their results and present them in a simple way to both technical/non-technical users. I hope you learned something new today!
I hope you took home some new concepts today! If you would like to get in touch, connect with me on LinkedIn.