
How To Beat The Crypto Market With Genius Entry And Exit Strategies
Trend following strategies rank top among the most successful trading strategies to use, even for novice traders. But just how do you even uncover a trend in crypto as a beginner? The answer is the Supertrend Indicator.
I have been testing the Supertrend indicator for the past six months and I have some interesting results.
Supertrend indicator was originally developed by Olivier Seban, to identify primary trends for futures, forex, and equities.
But nowadays you are likely to see the indicator in just every other market.
And that includes Bitcoin & Alts futures.
Supertrend has actually become a go to indicator for many crypto traders looking to exploit opportunities in the current bull market.
First off, I wanna give a shout to incomesharks who has gone out of his way to educate his Twitter followers on how to tap the power of Supertrend. If you follow incomesharks, you must have seen the Supertrend plotted over the top of the charts he shares on Twitter.
So, what is the Supertrend?
Simply put, as seen in this post on Quora, the Supertrend is a technical indicator, which offers you detailed buy or sell signals in a trending market. It does that by following a trend just like moving averages which is plotted on prices and their placement indicates the current trend.
What’s more, Supertrend uses the ATR (Average True Range) as part of its calculation which takes into account the volatility of the market. The ATR is adjusted using the multiplier setting which determines the sensitivity of the indicator.
Something to note is that the indicator works well in a trending market but can give false signals when a market is trading in a range.
Supertrend can give false signals when a market is trading in a range.
What I found out
My purpose for testing the Supertrend indicator was simple: to find out if it can give reliable buy and sell signals.
Bear in mind, not a single technical analysis tool can predict the future of markets with certainty, but these tools allow traders to formulate probabilities as a data point for basing trading decisions.
I use the Supertrend on TradingView. TradingView allows you to add the indicator as an overlay on any trading chart. And by the way, this is a free indicator, even on a free account, so you won’t have to pay anything to use it. As long as you’ve got a purpose for it, and know how to find it, you’re good to go.
This is how a chart with the Supertrend overlay looks like on TradingView.
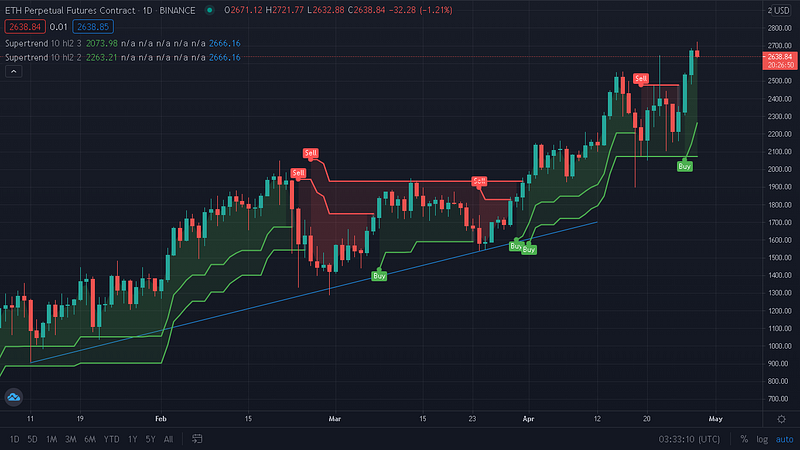
If you scroll back to chart A, you will notice that there is a pair of red lines and another pair of green lines. This is because I have two Supertrend indicators plotted on the same chart, or running simultaneously, but using different settings.
The settings bear two parameters, that can be adjusted for your trading style. The parameters include what is known as the period and factor.
On TradingView, the default setting for the Supertrend indicator has a period of 10 and a factor of 2. I opted to go with the default setting for the first indicator and only changed the factor to 3 in the second indicator. And that is how I managed to get two different signals from the same indicator.
When you set the factor to a low multiplier, what happens is that you will get many buy and sell signals, but there is a catch! Most will be false signals, just noise from the market. That’s is why you need to set the second indicator on a higher multiplier so as to confirm the trend direction.
Setting up your chart
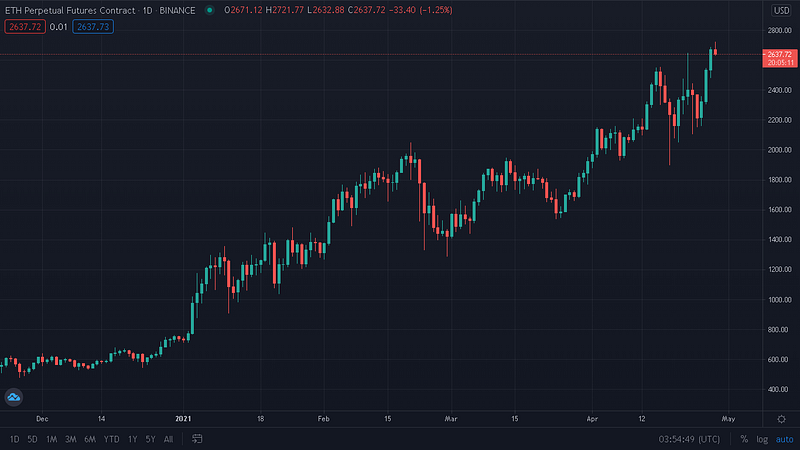
The chart on the daily timeframe gets more data, making it more useful for most trading decisions. But this is not to say that you shouldn’t set your chart on a lower timeframe. You will have it on the 4hr or 1hr and still do fine. It all depends on your goals.
You should start by drawing support and resistance lines and this should ideally be an area with two to three touches.
For the ceiling, you should look for the peak or top that has nothing around it. This will be your take profit level.
Then add the Supertrend indicator over the chart.
How do you get your entry?
The Supertrend indicator really simplifies this. You should enter a trade when both Supertrend indicators flip bullish. Remember, the Supertrend with a factor of 2 has more noise, so its a lot more common to see it activate (either green or red) because its set to a low multiplier.
Its always a good sign when the second Supertrend flips, because it kind of confirms the trend direction.
Another trick that can help eliminate doubt is adding other tools on the chart.
When used effectively with other tools, the Supertrend becomes really useful when making your trading decisions. The Supertrend works really well with the OBV (on balance volume) indicator. So, pull up your OBV and check for a trend. For example, you could check if there is more buying than selling or vise versa.
Something else would be to check if any of the resistance areas have been broken and retested.
With that ticked off your checklist, incomesharks would say you have enough bullish reasons to enter a trade.
Stop Loss
If you happen to employ the Supertrend at the core of your trading strategy, the stop loss has to tug along for risk management. And the area where you set your stop loss should never be adjusted to accommodate more losses. But if there is a breakout and the trade moves to profit you can adjust your stop loss by moving it up into the green area. This not only protects your profit but also ensures that you won’t have to take the originally planned loss if the trend is broken.
When you get your entry, you should set a stop loss of about 20% your position size. If you’d like more wiggle room, set the stop loss at 25% but not higher. Anything that risks only about 1% of the position size is okay. And this should provide enough support area before the breakout.
Take Profit
Your profit target also defines your exit strategy. You should be looking to take profit when the uptrend hits the first area of resistance.
Here you can exit the trade or just take at least half of the profit and wait for the market to hit the second area of resistance at which point you secure the extra profit.
Supertrend For Scalping and Swing Trading
I won’t tell you that Supertrend will make scalping easy because that would be a lie. I have never turned a profit scalping, not even with the Supertrend. Surprisingly, incomesharks does it and I still don’t know how. The thing is every time I set my chart on a low timeframe the Supertrend gives mixed signals. That is not to say it won’t work for you, rather you just need to back test the indicator until you get the desired results.
But swing trading becomes so easy when you learn how to work with the Supertrend. Like I said before, Supertrend works well in trending markets and what I have observed is that the indicator mostly requires patience from your part to prove to you that it can give you confidence to wait until a trend is broken.
I have made wildly successful swing trades by replicating what incomesharks does with the Supertrend.
And the rule is really simple. If the Supertrend flips green, its likely that there will be accumulation before the initial false breakout. What Supertrend does is it will plot a horizontal green line alongside the chart during the accumulation phase. Then the false breakout will happen and the green line will start rising up. But remember, its likely to be a false breakout. Be patient.
During all this waiting, you should check the OBV to see if there is any confluence with what the Supertrend is showing.
Wait for the reversal and the price to retest the horizontal green line. If the retest is successful, that will likely be a solid trade to take. Remember, set a stop loss below the green line, risking not more than 1% of your position size, because even the most solid trend can be broken in a matter of seconds.
Incomesharks actually did a minute long video about swing trading with the Supertrend.
If you can spare a minute, please tell me in the comments if you managed to get the Supertrend work for you.
I strongly advice that you try what I have said here on a testnet account. Almost all crypto exchanges have a testnet. Testnet coins are separate and distinct from actual Bitcoin or Alts. Remember to always do your own thorough research before putting aside real money for trading crypto.
Cheers!
I hope you enjoyed reading this. Please follow me to get more articles like this in your inbox. Also, If you’d like to support me as a writer, consider signing up to become a Medium member. It’s just $5 a month and you get unlimited access to Medium.