
What’s Up With The VIX?
Understanding The VIX And What It’s Trying To Tell Us
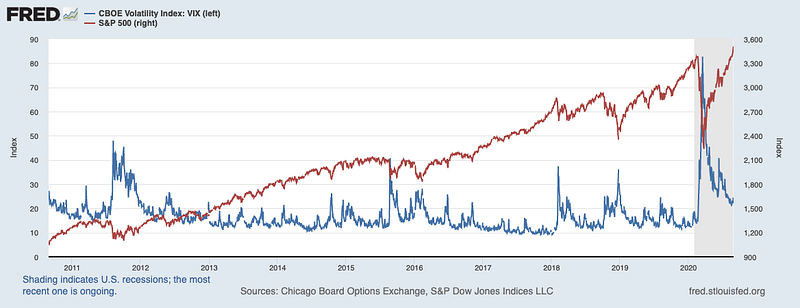
The past few days (writing this as of 8/31/20) have seen a strange phenomenon occur. The VIX (as proxied by VIXY, a long VIX ETF — fully explained later) has returned almost 10% at the same time that the S&P 500 increased by approximately 2%.
It’s weird that they’re moving in the same direction. VIXY and the S&P 500 are highly negatively correlated — meaning that when one goes up, the other usually goes down. The correlation between the two funds’ daily returns since 2011 is -0.81. That’s why funds like VIXY are widely used as portfolio hedges. For comparison, the most popular portfolio hedge out there, long duration U.S. Treasury bonds (TLT), has a -0.48 correlation to the S&P 500 — significantly less than VIXY’s.
In fact, since the March 2020 stock market crash, the VIX has remained stubbornly elevated. Usually, when the market is repeatedly registering new all-time-highs, the VIX hovers in the 10–15 range. In 2013, when the S&P 500 finally made a new high following the 2008 Great Financial Crisis, the VIX was at 13.62 — a level it remained close to for most of the next 7 years (besides the occasional bout of market volatility, one of which I covered in depth in this post).
So why does this matter? To understand, first we need to learn more about what the VIX is and isn’t.
Understanding The VIX
The VIX is a supposed forward looking measure of investor uncertainty. It’s calculated using the prices of a specific basket of S&P 500 options. We won’t go into the details of option pricing here, just remember a few things:
- An option is a type of derivative because it derives its price from something else, like a stock (the asset it derives its price from is called the underlying).
- If we own a call option (let’s focus on stock call options), we care about two prices — the current market price of the underlying stock and the strike price on our option. The strike price for a call option is the price that we get to purchase the underlying stock for, regardless of what price the stock is actually trading at. So for call options, we want the price of the underlying stock to rise above our strike price (so that we can pocket the difference between the actual price and our strike).
- Options have an expiration date. If on the expiration date, the price is still below our strike, then we’re out of luck.
Options are basically a race against time — if we own call options, we want the price to rise as quickly as possible and as much as possible so that we can get firmly in the money (“in the money” means price > strike).
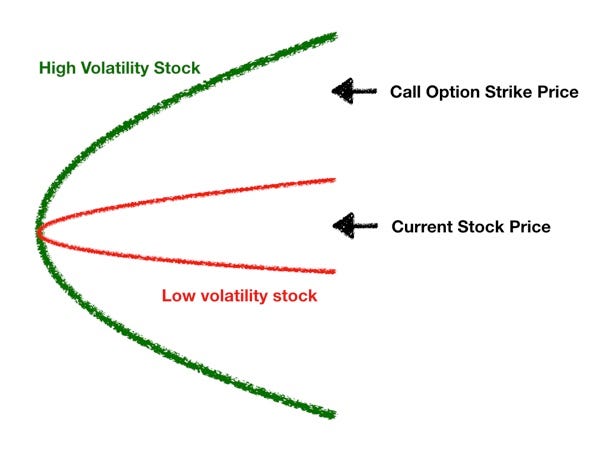
Now let’s think for a second, all things equal (including price), would you prefer to own an option on a stock with low volatility that moves very little (Pepsi) or an option on a stock whose price rockets around (Tesla). The obvious answer is we would prefer an option on Tesla because Tesla stock’s super high volatility gives us a higher probability of ending up in the money and turning a profit.
The picture above visualizes this. For the low volatility stock whose range of outcomes is depicted in red, the probability of ending up in the money is very small because the stock (barring some extraordinary catalyst) just doesn’t move very much. But for the highly volatile stock (green), there is a material probability of ending up in the money.
So all things equal, the more volatile the underlying asset is, the more an option on that asset is worth. In other words, volatility is a critical input to an option’s value.
The VIX takes advantage of this relationship by solving for the level of volatility that produces the prices observed on the basket of S&P 500 options mentioned previously. Thus, the VIX is an index whose value represents the IMPLIED annualized 30-day volatility of the S&P 500. For example, a VIX of 20 implies an annualized vol (short for volatility) of 20%. But to get the actual 30-day vol of 5.8%, we need to de-annualize it by dividing by the square root of 12:
20%/(12^0.5) = 5.8%What Does The VIX Actually Tell Us?
Anytime you put the word “implied” in the name of a metric like implied volatility, people like to assume the existence of a mystical ability to predict the future.
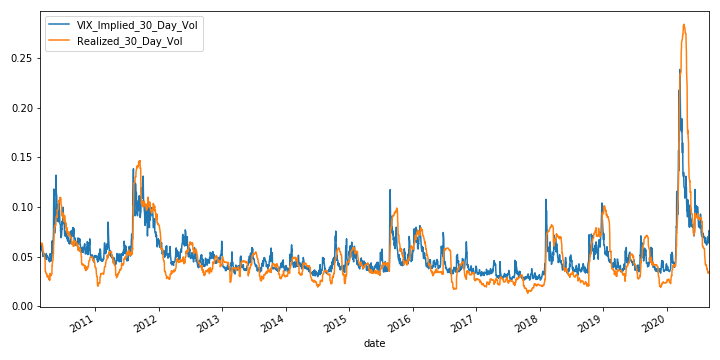
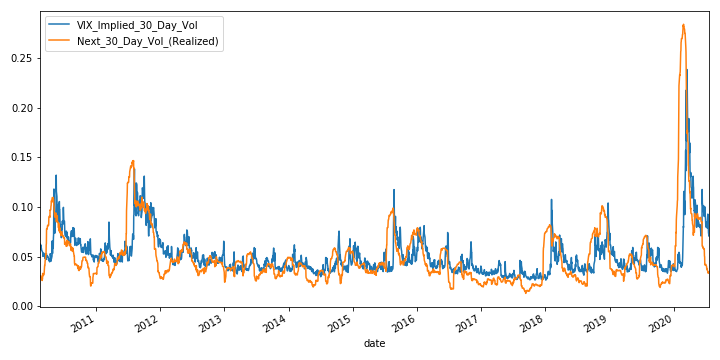
Yes, the VIX is a crowd-sourced measure of expected market volatility; but in this case, the crowd despite all its “collective wisdom” is not very good at predicting market volatility. Look at the plot below, which compares VIX implied volatility and realized volatility. They pretty much move in lockstep. The key is that the orange line plots the volatility of S&P 500 returns over the PREVIOUS 30 days, not the next 30 days — meaning that VIX implied volatility is highly correlated with backwards looking volatility, not future volatility.
To hammer in this point, here is a similar plot, except instead of backwards looking vol (previous 30 days), I graphed forward vol (next 30 days) in its place. If the lines line up perfectly, that would mean that VIX does predict future volatility. Instead, what we see is the orange line clearly leading the blue line (for example, the orange line spikes up first before the blue line follows). This is expected, if we could use the VIX to predict future changes in the stock market, we would all be rich (or this benefit would quickly be arbitraged away).
VIX Tends To Move Opposite The Stock Market
VIX is commonly called the Fear Gauge by market pundits. That’s because it tends to spike when stock prices crash (inducing investors to panic). The following scatterplot shows the relationship between daily percentage changes in the S&P 500 and daily raw changes in the VIX — as you can see, there is a strong negative correlation (market goes down, VIX goes up).
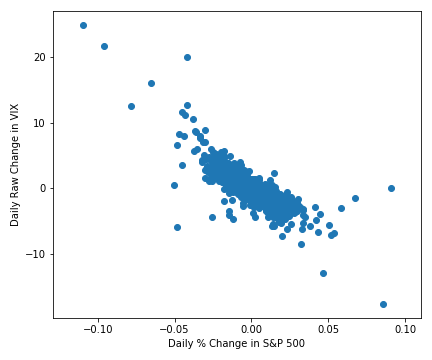
Astute students of statistics are probably thinking, “If VIX is a measure of volatility, why doesn’t it also go up when markets spike up?” Great question. Pure statistical volatility doesn’t care about direction, a big move is a big move regardless of if it’s up or down. And yes, a huge and unexpected up move in the stock market would put some upward pressure on the VIX (giving ETFs indexed to percentage changes in the VIX a convex relationship with the stock market).
But overall, VIX’s strong inverse relationship with the market holds due to the following factors:
Big Up Days Tend To Happen In Bear Markets
Big up days in stock markets usually happen in the midst of large drawdowns (like after a few weeks of crashing, stocks take a breather and shoot up 8% in one day). So these big up moves don’t impact the VIX that much because the preceding crash already caused the VIX to spike up. Said differently, usually by the time big up days occur, VIX is already really high and investors are already expecting large moves in either direction.
If big positive days in the stock market started occurring out of the blue during bull markets instead of primarily occurring in bear markets, the observed statistical relationship would probably change. But until then, it remains a hypothetical.
Complacency Vs. Fear
It’s important to keep in mind that the VIX is not a purely statistical construct. It’s a measure of investor uncertainty that embeds the aggregate emotions of market participants as well. To that end, market participants tend to associate rising stock markets with stability, optimism, and certainty causing the VIX to decline. And when markets crash, we are filled with feelings of dread, fear, and uncertainty causing VIX to spike.
The Fear Premium
There is a fear premium baked into VIX, especially when it’s low. Look carefully at the first plot (implied vol vs. previous 30 days realized vol) — when volatility is low (and markets are calm), the orange line tends to be below the blue line. This means that options markets tend to systematically price in a higher level of volatility than that which actually gets realized.
It’s basically an insurance effect. When calculating your insurance premium, insurer’s look at the actual probability of your house catching on fire (based on history and data) and then add a premium to that so that on average they can turn a profit (this compensates them for the risk they take on). The options markets work the same way — investors use options and VIX related derivatives to hedge. In order to motivate people to take the other side of this trade and bear the risk, they need to offer compensation, which comes in the form of a vol premium (the excess of implied over realized). Over time, because the implied probability of a big market move tends to be greater than the actual realized probability, investors willing to provide stock market insurance get paid a premium (in return for bearing substantial risk).
So why does this matter? Well, the size of the premium is a function of two things — expectations about future market volatility (extrapolating the recent past) and the supply and demand for insurance against market crashes. During good times, the supply of insurance goes up because more and more investors view the premiums as easy money (and write put options). At the same time, the demand for insurance goes down because investors get tired of paying for insurance that never turns out to be needed (fewer buyers of put options). This compresses the fear premium (a.k.a. the cost of insurance), putting downward pressure on the VIX when markets are calm or in an upwards trend.
What’s The VIX Telling Us Now?
That was a lot. In case you got lost (or didn’t read), here’s the key points:
- VIX is a measure of uncertainty about the future price of the S&P 500. The higher VIX is, the wider the distribution of possible future prices is expected to be.
- VIX goes up when the market goes down and down when the market goes up (they’re negatively correlated).
- VIX includes a fear premium (the implied volatility tends to exceed actual realized volatility) that is compensation for providing insurance against market crashes. The fear premium is a function of the supply and demand for market insurance.
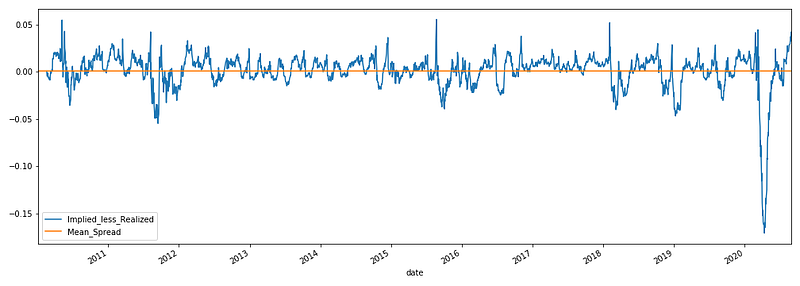
Now, let’s take a look at the fear premium over time. The current level of 4.1% is one of the highest readings of the past 10 years — implying that despite the steady rise of the stock market and low realized volatility of the past few months, the demand for insurance is quite high relative to the amount of investors willing to supply it. There is a lot of fear and uncertainty hiding below the surface of this bull market.
This has two interpretations. It could be an opportunity to sell insurance and take advantage of high premiums (not advisable unless you have a deep understanding of options and significant cash reserves). Or this could be the calm before the storm. But before we make brash prognostications, we should always consult the data. Is there a relationship between the size of the fear premium and future stock market returns? More specifically, does a high fear premium predict large negative returns?
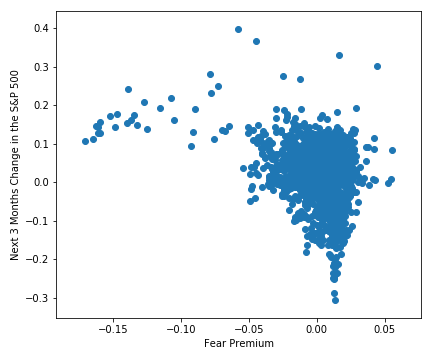
No, it doesn’t seem to. So while VIX rising along with the stock market makes me nervous and is definitely out of the ordinary (given their strong negative correlation with each other), there’s nothing in the data that says “time to sound the alarm”.
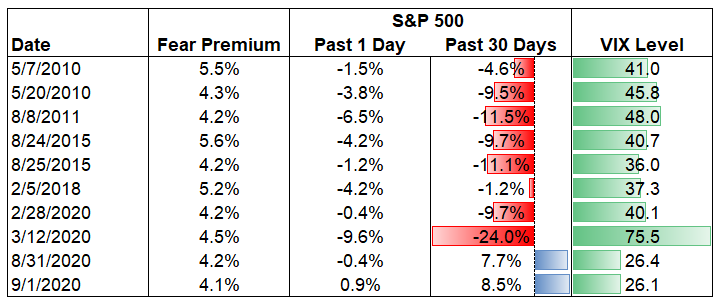
At the same time, I wouldn’t be in a rush to collect those seemingly juicy premiums. Notice how scarce the data is for high levels of the fear premium. We just don’t have that many observations. Check out the following table. Only on 8 other days (excepting 8/31/2020) over the past 10 years has the fear premium been 4% or higher. And on none of those other 8 days was the market making new highs. In fact on all of those other 8 days, the stock market declined and was in the middle of a significant drawdown.
This implies that we might be in uncharted territory (truly out of sample) or experiencing a regime change where some historical relationships may no longer apply for a time. During these times, liquidity, caution, and an open mind will prove very helpful. Cheers!