
“What, So What, Now What” for Successful Storytelling
The Best Storytelling Method for Data Analytics
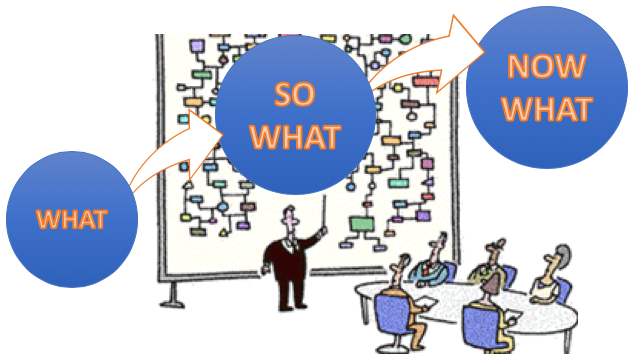
“What is the point?” Have you ever received this question from the audience, or similar questions such as “What is the story here?” or“What is the message?” If so, your audience is baffled. Too often, when we communicate our data findings, we don’t make our point clear and succinct. Your audience should never have to guess what message you want them to know. I have been using the story-telling structure “What, So What, Now What?” to connect complex data analytics with my audience. I have also trained my data science team not to fall into analysis paralysis. In this post, I will walk you through this effective tool. You will find there is no gap between your data analysis and actionable items. It is “WYAIWYR” — “what-you-analyze-is-what-you-recommend”.
“VeryCool.ai” is a hypothetical data science team that sells its latest and greatest machine learning fraud detection system to a bank. The bank currently uses a legacy rule-based system for its fraud detection. The “What, So What, Now What” framework can guide the conversation for a convincing case. This story can be tailored to any area of the business. It also applies to your weekly mundane operational meetings. By the way, you may ask why I use fraud detection to tell this story. Well, I have to admit I leverage my previous articles. I have written articles on fraud detection including “Anomaly Detection with Autoencoders Made Easy”, “The Growth of Fraud Risks”, “Stock Market Anomalies” and “Stock Market Anomaly Detection” Are Two Different Things”, or “Use the Isolated Forest with PyOD”.
What?
This is the first step. “What” states the facts. You inform the audience what’s going on without much value judgment. In news writing, this is the first paragraph for “what’s going on”. If you are not sure where to start, the following questions may help you:
- What happened?
- What do the data tell us?
- What’s the surprise in the data?
- What did you discover?
Let’s see how the hypothetical “VeryCool.ai” constructs this part:
“What” — The Fraud Detection Use Case
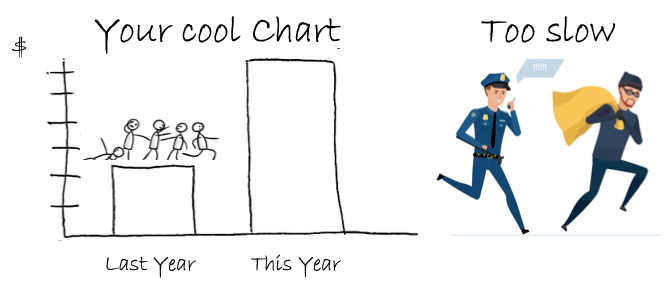
Losses and Damages due to fraudulent transactions have been outstanding in the financial services industry. The number of customers in the United States who experienced fraud hit a record 15.4 million people in 2016. Fraudsters stole about $6 billion from banks. The digital system also has created a rich environment for fraudsters. Fraud also hurts the reputation of a bank. Last year 20 percent of customers change their banks after experiencing scams. Look at Figure 1: “Your Very Cool Chart” below…
A legacy rule-based system is currently in place. Although it has 300 different rules for approving each transaction, these rules appear inadequate in detecting newly found fraudulent transactions.
The slow response has been our problem. We are not able to react quickly to stop the transaction or catch it right after. It takes about 40 days for a brick-and-mortar local bank to detect fraud.
By telling the facts, your audience is already thinking ahead for the reasons. Yes, you want them to think ahead and be hungry for what you are going to tell them. Many data analysts are too eager to tell people “So What?” without preparing the background information “What?”
So What?
Now, “So what?” is about opinions. This is where you introduce your analytical findings or conclusions. The following questions can help to frame your thought process:
- What does that data mean to the business?
- What’s your judgment?
- What has happened because of the facts?
- What do you expect to happen?
- What are the impacts of the facts?
Every business issue can demand analysis, but not every issue is worth analysis. The “So what” helps you focus on the issues that value the most. YOu also can direct you or your team to meaningful analysis and avoid analysis paralysis. (Talking about analysis paralysis, you should form a hypothesis to analyze the data, not chase the enormous amount of data for the facts that may already be known to many people. But that’s another story.)
Let’s see how “VeryCool.ai” presents findings:
“So What” — The Fraud Detection Use Case
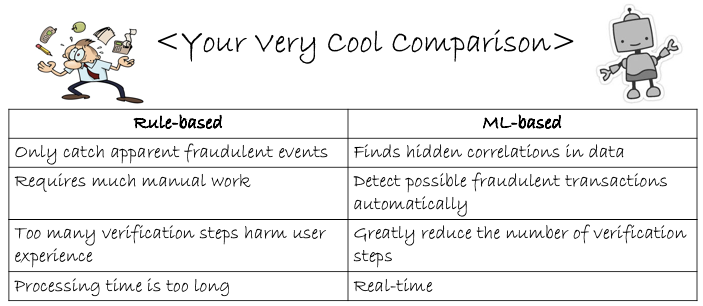
A machine learning fraud detection system is needed to catch accurately the evolving transactions and new ways of transactions. There are hidden and subtle events in user behavior that signals fraud. Machine learning allows for creating algorithms that process large datasets with many variables and help find these hidden correlations between user behavior and the likelihood of fraudulent actions. Look at Figure 2: “Your very Cool Comparison”.
A real-time system is needed to detect fraud quickly. This will prevent damages before the money is stolen. The ML-based system is a faster data processing and less manual work in reducing the number of verification steps.
Not bad, isn’t it? In this part, you already present the value on the table. People see the data insights capsuled in a very approaching way. Asking for the right data analytic tasks is an important skill, and organizing the findings in a good summary is also an important skill.
Now What?
“Now what?” turns your insights into go-forward actions. Your audience will ask you “Now What?” after listening to your “What?” and “So What?”. You will make recommendations based on your data analytics. Center your message on the following questions:
- What will you do to solve the problem?
- What actions have been taken?
- What is the result?
- What do we need to do to move forward?
- What have we learned? How will you use the insights that you discovered?
- What will you do differently the next time? What will you do the same?
- What hidden opportunities has this event uncovered? How can we use them for our benefit?
Let’s see how “VeryCool.ai” conclude with its message:
“Now What” — The Fraud Detection Use Case
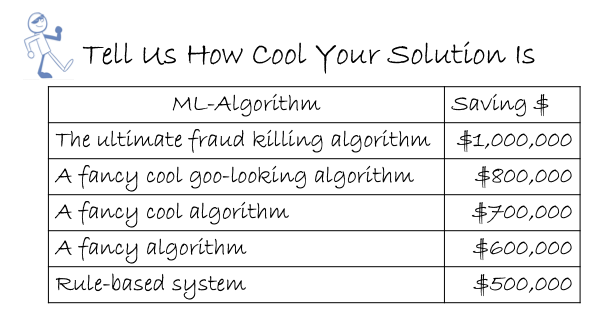
The ML-Based system outperforms greatly the rule-based system. Its “Ultimate Fraud Killer Algorithm” is the terminator for fraudsters. Based on retrospective data analysis, the system can save $1,000,000 which was lost in the past. The model looks at variables such as transaction size, location, time, device, and purchase data to determine if a transaction is fraudulent.
Real-time Detection is made easy. The system can escalate fraudulent customer behaviors or suspicious transactions in less than two seconds.
I have written many articles for all levels of data science professionals. If you find the above tips useful, you will find “Data Science Modeling Process & Six Consultative Roles” useful as well. Other topics include “Management”, “model adoption”, “Identifying causality”, “Natural language processing (NLP)”, “Data Visualization”, “Modeling techniques”, and so on. You can bookmark the summary article “Dataman Learning Paths — Build Your Skills, Drive Your Career”.


