
What Makes a Great Day?
Insights from seven years of recording my daily performance.

The internet is full of advice on how to live a better life. This is another one of those articles — with one little twist: quantification.
Yep, I’ve been quantifying the quality of my day for the last seven years, collecting about 30000 data points. You can check out the previous article to see how this started paying real dividends recently, as I finally cracked the code of making every day a great day.
This article will take a more detailed look at the insights hidden within these 30000 data points. I’ll try my best to present these insights in the least boring way possible, but please mentally prepare yourself to witness a few Excel graphs.
The interested reader can scroll to the bottom of this article to learn more about the data I collect every morning, but everyone else can simply read on to see the results.
The short version
Since this is quite a long article, I’ll open with a short and sweet version.
Healthy eating habits consistently emerged as the most important factor for having a great day. Exercise was also important, but less influential than healthy eating.
Energy and motivation are critical for having a great day. Not surprisingly, these factors are strongly boosted by healthy eating and exercise. They also receive a healthy boost from getting things done using a to-do list.
Ticking many things off my to-do list correlates well with healthy eating habits. Keeping busy appears to be a great way to avoid chocolate or ice cream binges.
High productivity is also strongly correlated to having a great day. In my case, it was clear that my side projects competed with my real job for my limited supply of daily productivity. To avoid any problems this may cause, I have been proactively working over the last two years to reshape my job description to align well with my interesting side projects.
Stress levels seemed to have no clear effect on the quality of my day. However, higher stress levels clearly resulted in higher productivity. Working from home appears to be a way to reduce stress at the expense of lower productivity.
Finally, the data showed that momentum matters. Yesterday is a good predictor of what today will look like. The smart move is to work hard at maintaining good streaks and immediately break bad ones.
Identifying the most influential factors
My methodology for data collection changed a bit over the years, but it has been reasonably consistent since 2015. I will therefore only present data from the last four years in this article.
Our first graph shows the main results. Please interpret this bunch of vertical lines as follows: the taller the bar, the bigger the influence of that factor (in that particular year) on the overall quality of my day.
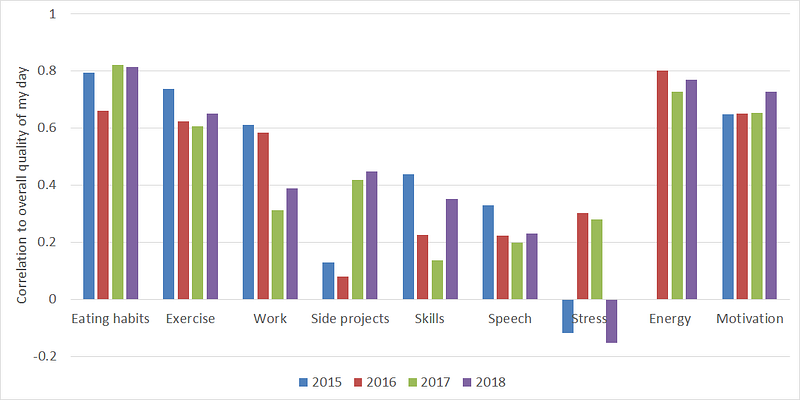
Out of the nine factors I tracked, my eating habits had the biggest effect on my day. You can see that the correlation is around 0.8, which really is very high for these kinds of studies.
Out of the nine factors I tracked, my eating habits had the biggest effect on my day.
If I let myself go and ate a tub of ice cream, I would inevitably have a bad day. I’ve known about this strong correlation for almost the entire seven-year period, but, rather foolishly, did not do much about it until recently.
The previous article described how I finally cut out binge-eating (and its toxic combination with binge-watching) from my life. This was a decisive move in achieving my ongoing streak of great days.
I feel like I must disclose that typing is pretty difficult right now because I’m continuously drawn into the face-palm position for not doing this earlier. *Sigh* Let’s move on…
The second and third most important factors are the levels of energy and motivation I experienced in a given day. My interpretation of this result is that we need to strongly prioritize the things that motivate and energize us.
My interpretation of this result is that we need to strongly prioritize the things that motivate and energize us.
An inspiring job may be the best way to capitalize on this strong correlation. It’s well-known that great jobs motivate and energize people, but these can be tricky to get hold of.
My particular idea of a dream job is research into our great 21st century sustainability challenge (how we can quadruple the global economy and bring CO2 emissions below zero). Not only that, but I also want complete creative freedom regarding the scope and execution of this research.
Obviously, this is not something I could just demand from the get-go. There are many practical constraints related to the procurement of research funding and the needs of other members of the research team.
Luckily, this is an area where I did take proactive action. For years, I worked strategically to shape my role in the team and to earn my creative freedom. 10 months ago, the pieces finally started falling into place, kicking off my ongoing streak of great days.
Next up, we have exercise. It was interesting that my eating habits had a consistently larger effect than exercise on the quality of my day. Intuitively, I’d expect it to be the other way around, but the data has spoken.
It was interesting that my eating habits had a consistently larger effect than exercise on the quality of my day.
Even though it fell just short of finishing on the podium, exercise still put in a commendable performance. I therefore remain fully committed to at least an hour of daily movement.
Work and side projects come in next. In fact, if I add their data together to create a new variable called “production”, the correlation coefficient for 2018 comes in at a value of 0.75, which is right up there with the front-runners.
Clearly, creating value is a great way to create a good day. Something that helped a lot is that my primary occupation and side projects have become increasingly congruent in recent years.
The interesting thing is that it was my primary occupation that migrated towards my side projects, not the other way around. If you manage to maintain a productive side project that you are willing to do for free, it’s generally a smart strategy to turn that into your primary occupation.
The remaining three factors (skills, speech and stress) had a limited impact on my day. Practicing my skills (hobbies) had a significant effect, but it’s not large enough to do deserve special mention.
Speech refers to my stuttering problem. It was a relief to see such a small effect of this problem on the overall quality of my day. Stuttering is an emotionally strenuous experience, so my instinctive expectation was definitely for a much larger impact.
Most people have some kind of burden to carry around. Mine is the inability to speak fluently under pressure, yours will be something else. What this data suggests is that you might be overestimating the actual negative impact of this burden on your life.
Finally, I was pleasantly surprised that the level of stress I experienced had only a small effect on my day. In some years, worse stress levels actually led to a slightly better day (negative correlation).
I was pleasantly surprised that the level of stress I experienced had only a small effect on my day.
Stress can be good (motivation for good performance) and bad (emotional strain). This result simply shows that the good and bad effects of stress cancelled out pretty evenly in my case.
Other important influences
Over the past three years, I’ve also tracked four additional factors that may have an influence on the overall quality of my day. These are displayed below.
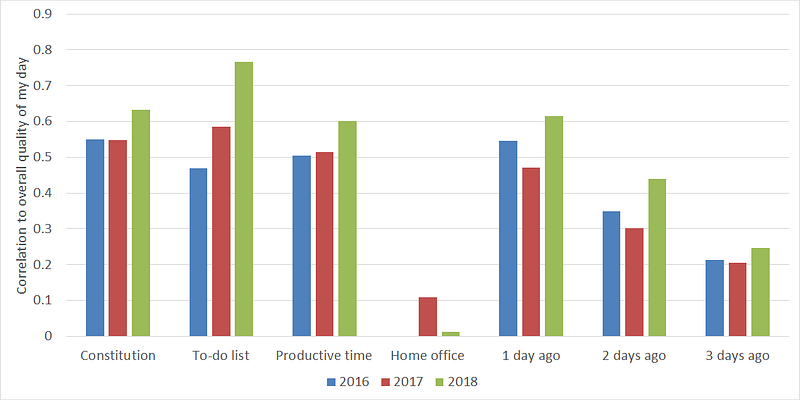
The idea with my personal “constitution” is to redefine my core beliefs so that I can do the right things every day, not because I’m forcing myself, but simply because that is who I am.
It’s a powerful idea and, even though I only recently managed to make it a permanent feature of my day, it has clearly served me well over the years.
My to-do list has also seen some significant improvements over the past three years. In 2016, I just started using a simple list in Microsoft Outlook that I checked every once in a while. This was upgraded to a recurring meeting in Outlook that I updated every morning in 2017.
As the graph shows, proper to-do-listing seems to be paying off handsomely.
Then, in 2018, I started taking the humble to-do list much more seriously. I switched from my makeshift Outlook solution to a nice little Chrome extension called Momentum. As the graph shows, proper to-do-listing seems to be paying off handsomely.
Productive time refers to the hours I spend on my computer doing productive work. It is tracked automatically by a great little app called RescueTime (highly recommended). The data clearly shows that highly productive days on my PC are generally also very good days.
I sometimes work from home if there are no important face-to-face meetings scheduled for the day. As shown, this seems to have no effect on my day.
The last three factors in the graph show the degree to which the quality of previous days predicts the quality of today. As expected, the correlation weakens as the distance between days is increased.
Streaks matter: if yesterday was good, it’s likely that today will follow suit.
However, the data clearly shows that momentum is important. Streaks matter: if yesterday was good, it’s likely that today will follow suit. Positive momentum should be cheered on with great gusto. Bad momentum should be broken ASAP.
More detailed correlations
Finally, we take a look at some correlations between all the different factors discussed above using data from the year 2018.
Let’s start with the green boxes in the table below. I know it looks very complicated at first glance, but just keep your eyes on those green boxes. Each one shows a strong correlation between the factor listed above the box and the factor listed to the left of the box.
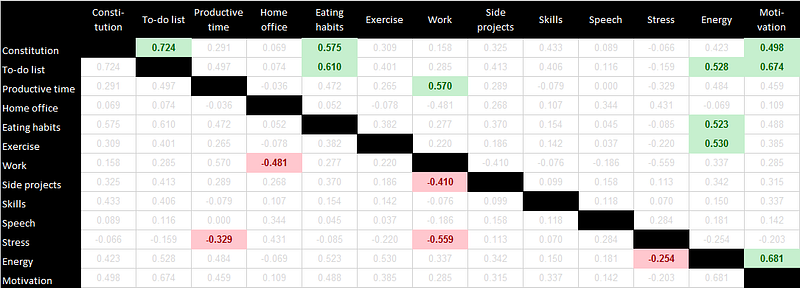
For example, the green box on the top left indicates the strong correlation (0.724) between my alignment with my constitution (to the left of the box) and the number of items ticked off on my to-do list (above the box).
Interestingly, this is also the strongest correlation of all. Clearly, my ideal self is someone who gets things done. The other two green boxes in the top row show that my ideal self seems to like eating healthily and staying motivated.
Moving on to the green boxes in the next row, we see that the to-do list continues to feature strongly. Probably the most interesting result is the strong correlation with my eating habits, even though I never write any to-do’s related to eating.
I’m less likely to fall into unhealthy eating habits when I’m busy getting things done.
This simply indicates that I’m less likely to fall into unhealthy eating habits when I’m busy getting things done. Ticking off many things on my to-do list also appears to be great for my energy and motivation.
Next, we see a pretty obvious correlation between productive time and work. Not much more to say about that…
Finally, my energy levels are most strongly correlated with my health habits (eating and exercise) as well as my motivation. Good health habits are known to increase energy levels and it’s obviously much easier to feel motivated when you are full of energy.
Let’s now move on to the red (or maybe pink) boxes. All five of them are related to stress and work.
Interestingly, I appear to have more energy when I’m more stressed.
Worsening stress levels (generally perceived as a bad thing), clearly gets me to work more and spend more productive time on my PC. Interestingly, I appear to have more energy when I’m more stressed. This shows the positive effects that moderate stress levels can have on productivity.
To be honest, I’m not very happy about this and hope to see a change in this year’s data now that I have finally earned more creative freedom.
Next, we see a clear negative correlation between work and side projects, indicating that these two categories are competing for my productive time. Fortunately, they are now becoming increasingly aligned, so my boss has no reason to be alarmed.
I also clearly do less work when I’m working from home. In my defense, this statistic is skewed by the weekends that I also log as working from home. As could be expected, the data also indicates that I’m much less stressed when working from home. A home office therefore produces less work, but this work could be more sustainable over time due to lower stress levels.
Appendix: My morning data collection routine
Every morning, I take a minute to quantify the following elements of my performance on the previous day:
- Eating habits on a scale from -5 (a gluttonous binge on unhealthy food) to 5 (nutrient-rich food only with slightly fewer calories than the RDA).
- Exercise from 0 (complete stagnation) to 10 (morning and evening yoga, light weights session and the equivalent of a 10 km cross-country ski or rollerblade trip).
- Work on my primary occupation as a research scientist from 0 (not even thinking about it) to 10 (eight highly productive hours).
- Work on side projects like this article and my writing on the 21st century sustainability challenge from 0 (not even thinking about it) to 10 (eight highly productive hours).
- Practicing skills like music, ice skating or a new language from 0 (nothing) to 10 (two hours of dedicated and deliberate practice).
- Speech where I rate my stuttering problem from -5 (totally inhibiting my ability to communicate) to 5 (total freedom of verbal expression).
- Stress levels from -10 (constant anxiety about the future) to 0 (no worries whatsoever).
- Energy levels from 0 (difficult to even get out of bed) to 10 (cannot wait to get started on the next task).
- Motivation levels from -5 (my life has no purpose) to 5 (I’m gonna save the world someday).
The overall quality of my day referred to in this article is simply the sum of the scores from these nine categories. My long-term average is about 19, but my ongoing streak of 280 days has boosted me to over 30 points per day.
In addition, I track a few other factors that could influence the overall quality of my day:
- The five individual components of my constitution tracked on a scale of -5 (total misalignment with my ideal self) to 5 (I am my ideal self).
- The number of to-do list items I ticked off on Momentum.
- The number of highly productive hours logged by RescueTime.
- An estimate of the fraction of my productive time on work and side projects I spent in my home office (as opposed to my work office).
I’m taking this more seriously in 2019 and have committed to tracking several additional variables. Next year’s article should therefore contain plenty of interesting new insights.


