
What is the Welfare-Optimal Discount Rate in Rapid Energy Transitions?
Let’s talk about this critical but poorly understood parameter in the expansion of clean energy.
“Net-zero by 2050” has become quite fashionable in energy and climate circles in recent years. Even though near-term projections continue to deviate strongly from this ideal, it is worthwhile to consider the implications of such a rapid shift. This article focuses on one of the most important parameters in the energy transition: the discount rate.
If we want a rapid transformation, the welfare-optimal discount rate will be high because of the large emphasis on near-term change. This implies that distant decades are strongly discounted relative to the near-term future.
Within the economic system, high discount rates (or financing costs) tend to favor technologies with low capital costs because they can create more near-term impact for a given amount of investment.
An Illustrative Example
Let’s compare two fictitious technologies supplying a steady stream of clean energy at a capacity factor of 90%.
- High CAPEX, which has high capital costs of 5000 $/kW but low operating costs of 10 $/MWh.
- Low CAPEX with low capital costs of 1000 $/kW and high operating costs of 50 $/MWh.
The top-left graph in the figure below shows that, over a 30-year lifetime, the High CAPEX technology is far cheaper because its low running costs compensate for its high up-front costs already by year 12. As shown on the top-right, however, the Low CAPEX option can achieve much more rapid initial scaling when we have a fixed annual budget to spend. By year 10, we can no longer expand the Low CAPEX fleet because the high operating costs of these plants consume our entire annual budget, but by that time, we have already generated a lot more clean energy than with the High CAPEX option.
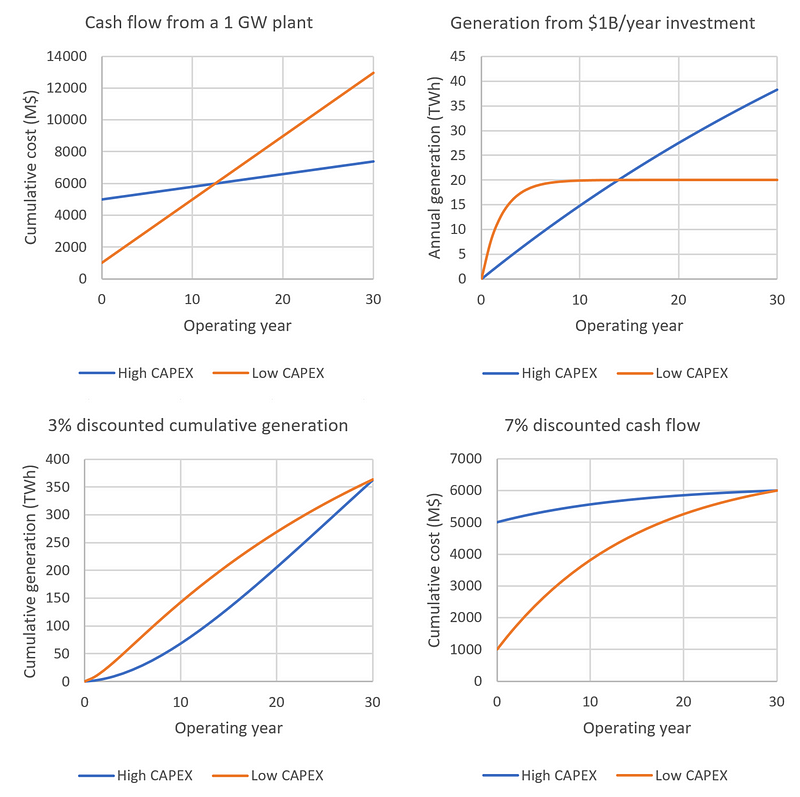
Now, let’s say our goal is to avoid a fixed amount of CO2 by generating a certain amount of clean energy over a period of 30 years. We will also discount future generation at a low rate of 3%, commonly employed for CO2 emissions because technology is expected to improve, making future plants cheaper. As shown on the bottom-left in the figure above, the two technologies hit the same cumulative generation target after 30 years, with the Low CAPEX option jumping ahead initially and the High CAPEX option catching up in later decades. Thus, for the purpose of avoiding a certain amount of CO2 by a certain date, they are equal.
To reflect this equality from an investment perspective, we need to apply a 7% discount rate to the cash flow analysis, as shown in the bottom-right graph. Hence, for the purpose of rapid decarbonization by a certain date, the welfare-optimal discount rate is around 7%.
Of course, this example assumes that everything goes exactly according to plan (zero risk). However, as discussed in an extensive previous article, clean energy expansion is rife with risk and volatility. We therefore need to add a risk premium of at least 5% (the historical equity risk premium) to our 7% welfare-optimal discount rate, arriving at 12%.
In the developing world where the energy expansion also drives economic growth for lifting billions of people to decent living standards, the welfare-optimal discount rate would be considerably higher still. Technologies with lower capital costs can be expanded more rapidly to drive near-term growth that generates more funds for investment in future generators. The premium here would be similar to the difference in energy growth rates — around 4% for China and India vs. 0% for the US and EU over the decade before the pandemic (based on BP statistical review data).
Comparison to Current Financing Costs
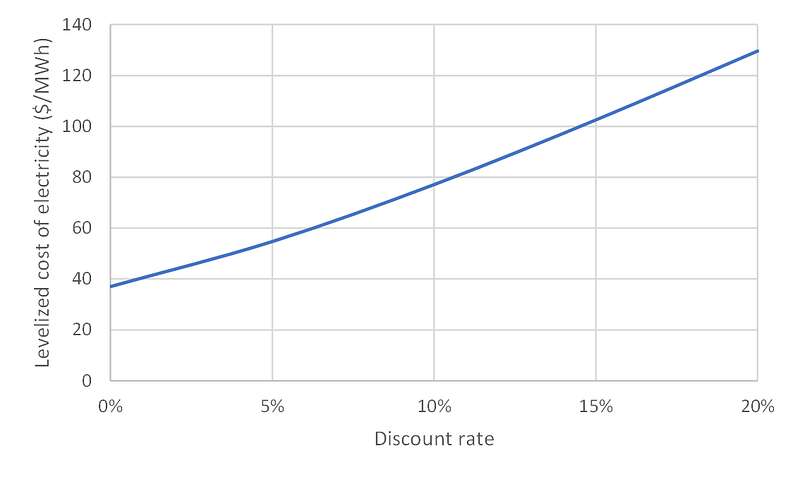
The media regularly reports on some extremely low renewable energy costs, especially solar PV. But these estimates generally rely on very low financing cost assumptions (e.g., 2.5% in the latest Fraunhofer study), which are far below the welfare-optimal range of 12–16% needed for a rapid transition. This has large implications because increasing the discount rate from 2.5% to 12% for solar PV would double the levelized cost:
Why this enormous difference? Well, there are two main reasons:
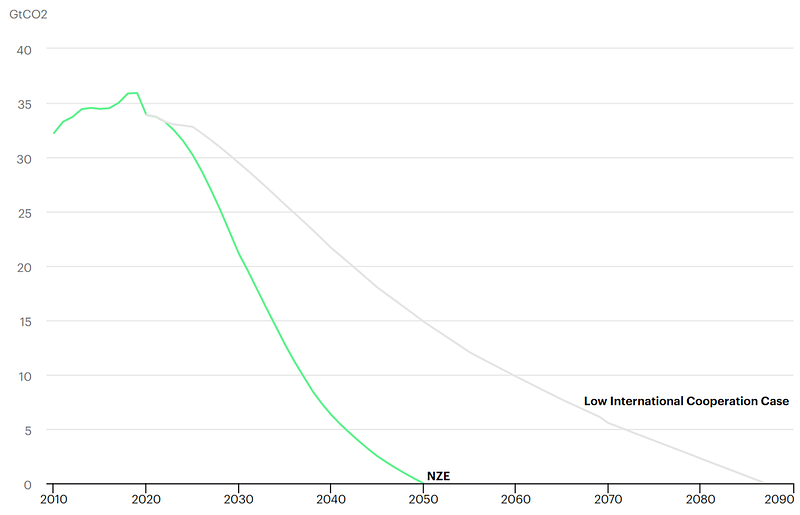
- Renewable energy is being expanded about 4x too slowly for achieving net-zero by 2050. If the transition can happen more slowly, the welfare-optimal discount rate reduces substantially. For example, the zero-risk optimal discount rate calculated earlier reduces from 7% to 2.5% if the timeframe for cumulative clean energy provision is increased from 30 years to 60 years.
- Supportive policies shield investors from market risks. For example, winning a renewable energy auction grants a PPA that guarantees a fixed price for the produced electricity regardless of declining value and increasing integration costs as more renewable energy is brought online during the plant lifetime. This transfers risk from investors to taxpayers.
It will be interesting to watch this space over the coming years. Policymakers can certainly keep financing costs far below the welfare-optimal discount rate, even if capacity expansions accelerate. However, this would be a clear indication that the transition is being done in an inefficient manner at a large cost to society. I hope such distortions do not persist for long.