
What is the difference between Quantitative and Technical Trading?
Become a scientific trader
Below is a candlestick chart of Ford’s daily price. Take a look. What patterns do you see?
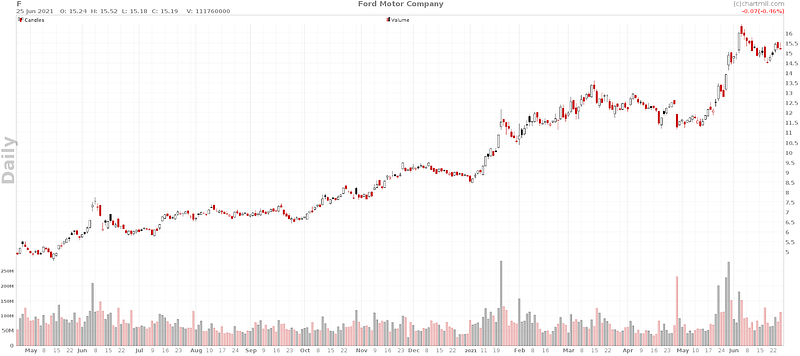
Depending on your skills in technical analysis, you might be able to spot some very clear patterns in this price action.
Possibly, there is a bull flag.
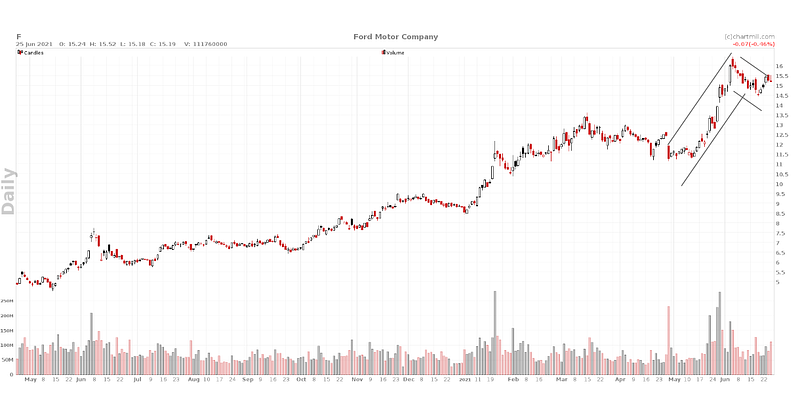
Or, perhaps it is heading into a double top pattern? Maybe there’s an ascending triangle on the far end? It could be something else entirely.
Given the pattern that you see, you’ll likely have some sentiment regarding the upcoming movements of the stock. If it’s a bull flag, then you’re looking to buy before it moves higher. How much higher? That’s not always clear Moreover, what precisely constitutes a bull flag versus another pattern? That often depends on the trader you ask.
Technical Analysis
Trading based on charts patterns — often overlain with various indicators — is the hallmark of technical analysis. Traders in this area will discuss head-and-shoulder patterns, support and resistance levels, cup-and-handles, Fibonacci retracements, and may use a variety of technical indicators like MACD or RSI. Based on the patterns in the charts and the confluence of indicators, traders will have certain forecasts, price targets, and levels for the market or their preferred instrument to trade.
While it all sounds very precise and sterile, I can’t help but feel like I’m watching two mediums divine the weather from entrails when I listen to technical traders debate chart patterns.
The basic trouble with technical analysis is that it is a visual discipline. Traders read charts to pull patterns out and make trades, making it much more of an art than a science. In the best case scenarios, traders will have some strict rules they adhere to on entries, stops, targets, and so forth, but more frequently (especially among the novices), traders will let their gut and intuition guide them as they bleed money until they’re forced to close their account.
While some traders are able to make great returns from technical trading, it seems that this is more of a skill honed from closely following markets and learning to trade through trial-and-error as well as developing a number of rules they can use in their own style, rather than a repeatable process that anyone can emulate.
These visual inspections of charts are not quantifiable, and thus they become untestable, i.e. unscientific, in the hands of the vast majority of traders.
Scientific Trading
To trade scientificially, you need to have a testable strategy. This is the dividing line between quantitative traders and everyone else.
Quantitative traders (or quants) burst onto the Wall Street scene in the 1980’s — many were physicists, engineers, or mathematicians, and were dubbed “rocket scientists” by the old Wall Street crowd — where they applied computers (a new thing at the time) and statistics to trading. Drawing on techniques in signal processing, natural language processing, and other fields, they were able to build some of the most successful investment careers of all time, and it was done because of the focus on testing.
Quantitative trading comes in many varieties. Some traders develop sophisticated pricing models for derivatives, risk, and so forth, and trade when the model indicates the market price has deviated from their estimate. There are market makers and liquidity providers who can make money based on order flow models. There are statistical arbitrage traders who look for price deviations between historically correlated asset classes. And some may superficially resemble the technical traders in that they use technical indicators and market patterns to make trading decisions. The major difference in all of these cases comes back to the idea of testable systems and strategies.
Make your Strategy Testable
Testable strategies aren’t incredibly difficult to derive. You simply need a set of rules to cover your investment and these need to be adhered to rigidly. Once you have that in place, you can run it live and keep track of the results, or (what we’d recommend) is that you test it first on historical data to see how it performed. This second option will probably save you a lot of money.
Data is widely available so backtests can be run where these rules are implemented on historical data to simulate the performance of your strategy in the past. By being careful with your testing and strategy design, you can develop a strategy that fits your risk tolerance and you are comfortable trading to make money.
Unfortunately, building a high-quality backtest will take some time, some money, and some coding knowledge to do it properly. We’re working to make this as quick and easy as possible by developing a no-code framework built on professional software and high-quality data to make these techniques readily available to you. If you have a trading idea, we want you to go from 0 to testing and trading as painlessly as possible with results that you can rely on.
We want to make every investor a scientific trader. Sign up below to join our waitlist.


