
What is a time series baseline model and how is it used?

A baseline prediction will give the data scientist an idea of how well other models are likely to perform on the time series problem. It is a point of reference for all modelling techniques on a particular problem. If a model achieves an error at or below the baseline, the technique needs to be corrected or abandoned.
Before a baseline technique can be established, three things must be available, being:-
- A time series data set to be used,
- A sampling technique to be used, such as splitting the dataset into training and testing sets, and
- A performance measure, such as root mean squared error.
The three properties needed to make a technique for establishing a good baseline measure are that it is simple, fast and repeatable.
One way to establish a baseline technique is to measure the error of an element that is one step ahead of itself. For example, if the elements of a time series are known, the prediction for time t will be t+1.
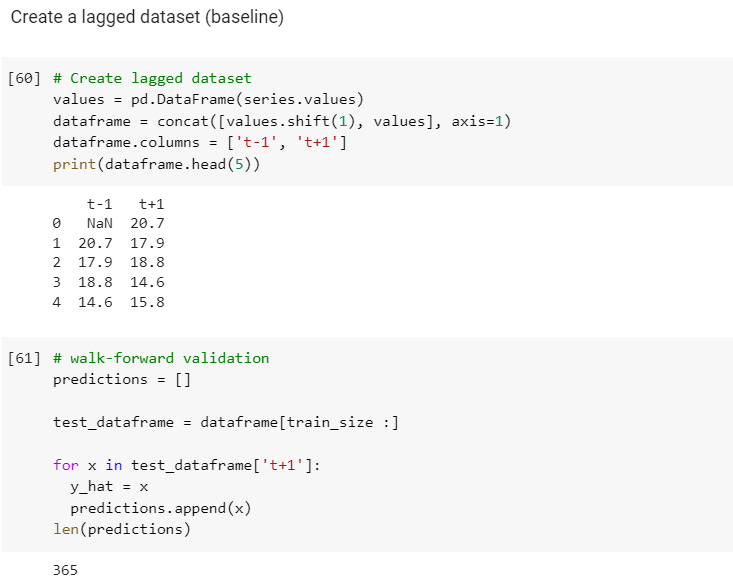
I have included this technique, called the persistence technique, in a program I have written to compare different time series models to each other. I did this by creating a lagged dataset:-
- I created a dataset, values, which was based on the time series dataset, series.
- I then shifted the values by one to make an extra column in the dataset in a new dataframe, dataframe.
- I named the columns of the dataframe ‘t-1’ and ‘t+1’.
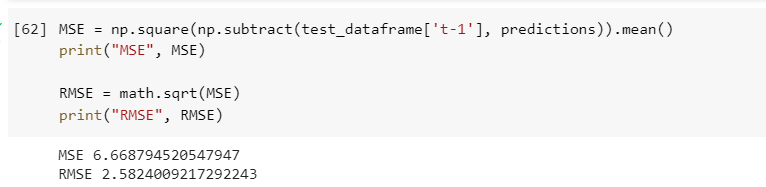
Once the dataframe with the lagged time series had been created, I performed a walk forward validation by:-
- I created an empty array, predictions.
- I created a new dataframe, test_dataframe, which is 10% of the original time series.
- I created a for loop that iterates through all of the elements in the test dataframe column ‘t+1’.
- Through each iteration, y_hat was the value of the corresponding element in ‘t+1’.
- Y_hat was then appended to the array, predictions.
I then checked the error of the first column of test_dataframe, ‘t-1’, and predictions (which in reality is merely ‘t+1’ in test_dataframe. In this instance the root mean squared error, rmse, is 2.58:-
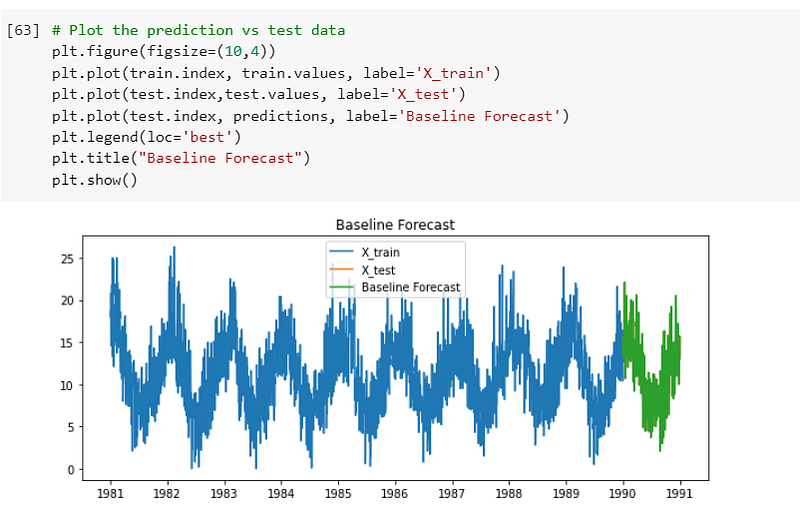
I then plotted the predictions onto a graph, which can be compared to the test dataset:-
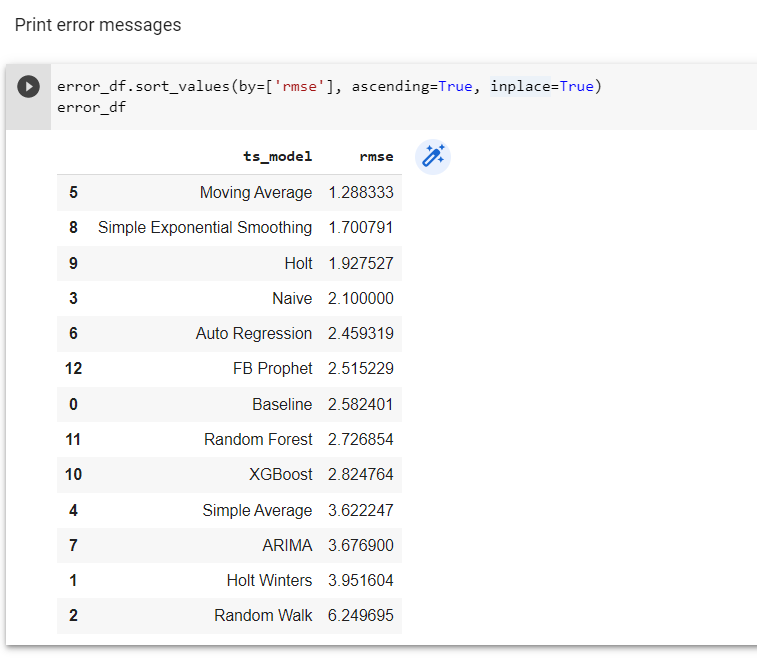
I created a dataframe, error_df, which records the rmse of each model (13 in all) that I used in the program. The baseline rmse ranked 7 in the listing, which reveals there are 6 models that performed better than the baseline and 6 models that performed worse.
The models that outperformed the baseline model are:-
- FB Prophet
- Auto Regression
- Naive
- Holt
- Simple exponential smoothing, and
- Moving average
The model that outperformed the other 12 models is moving average, so perhaps this is the best model to use in this time series:-
In conclusion, a baseline needs to be created and only models that outperform the baseline should be used to ensure optimal accuracy of predictions.
More content at PlainEnglish.io. Sign up for our free weekly newsletter. Follow us on Twitter and LinkedIn. Check out our Community Discord and join our Talent Collective.