
What Does “Exponential Growth” Really Mean, and How Does It Work?
When someone on TV says “XYZ is growing exponentially!” they usually mean it’s giiiinormous. But that’s not what “exponential growth” means.
Introduction
Human beings are surrounded by things that grow exponentially in so many parts of our lives:
- Semiconductor chip densities (“Moore’s Law”)
- Patient count during a pandemic
- Investments over time — whether it’s money in the stock market or in a savings account earning 2% per year
- Cancerous cells spreading throughout a human body
- A fire spreading through a building
- Sales of a popular product
- Weed growth in your backyard
Examples of exponential growth are everywhere. So it’s very helpful for people to have a sense of what “exponential growth” means and how it generally works.
That understanding helps us whether exponential growth is working to hurt us:
- virus growth and patient growth during a pandemic
- impact of carbon going up into the atmosphere on climate change
- cancerous cells spreading through a human body
or to help us:
- density growth of transistors on semiconductor chips
- sales growth in a business
- investment growth over time
Fortunately, the concept of exponential growth is super-simple.
Over the next few articles, you will learn:
- What exponential growth is and how it works.
- 3 parts of an exponential curve that you have to pay attention to.
- How to figure out when an exponential curve is going to impact you — whether it’s hurting or helping.
- Insider tricks for looking at exponential curves over long periods of time and using that to see farther into the future than at least 98% of the rest of the population.
Quick Definition of “Exponential Growth”
First, the correct definition of “exponential growth” is NOT that it is gigantically enormous (“ginormous”).
Exponential growth is when something grow by a PERCENTAGE each period of time.
That’s it.
The formula looks like this:
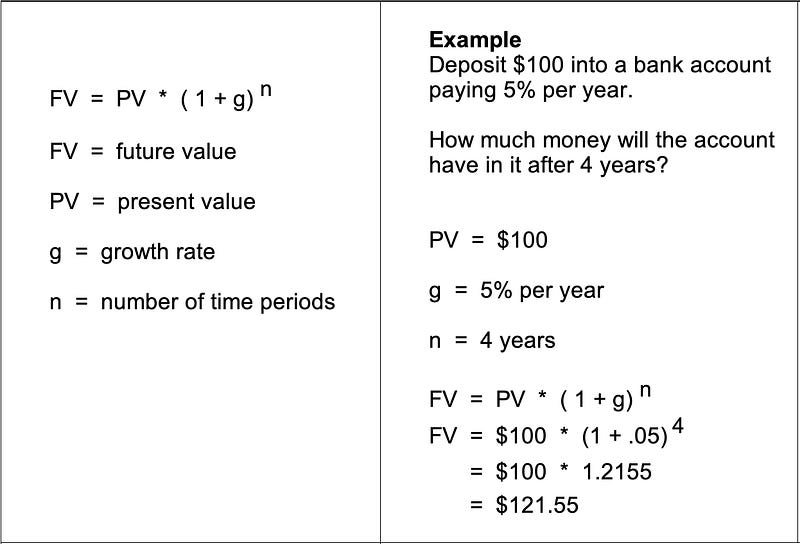
Something growing exponentially can be growing by a large percentage or a small percentage each period of time. “Big or small” growth doesn’t matter. “g” can be 5% per year or 70% per year. What DOES matter is that it is growing by a percentage each period of time.
The periods of time can be measured in minutes, hours, days, years, or centuries. The “number of time periods” part also doesn’t matter.
What does matter is that the thing is growing by a percentage every hour or day or year or whatever the period of time is.
Example #1. A savings account at a bank
Let’s imagine that we have a choice of depositing $100 at Bank A or Bank B.
Bank A will pay us 5% SIMPLE interest per year.
Bank B will pay us 5% COMPOUND interest per year.
Bank A will pay us 5% of the original deposit amount every year. So that means Bank A will pay $5 ( = $100 x 5% ) per year, every year. That’s what simple interest is.
Bank B will pay us 5% of whatever the amount is on deposit at the beginning of the year. So as the amount of money in the savings account grows over time with Bank B, the amount of interest getting paid each year will also grow.
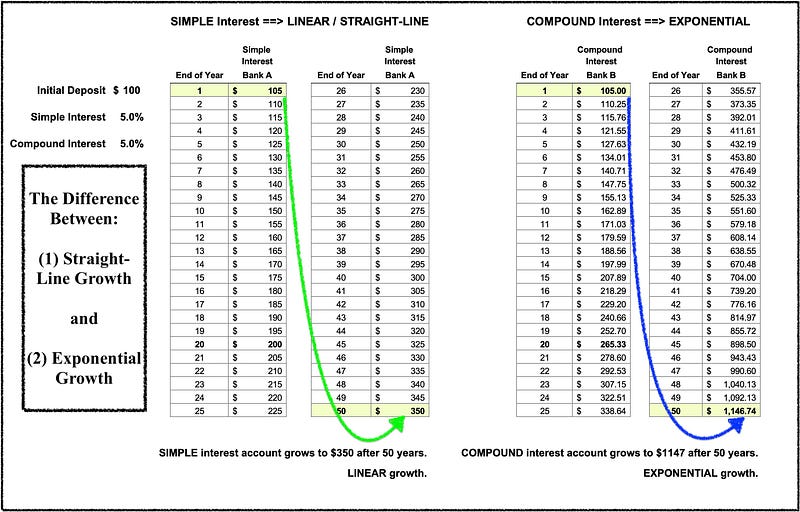
Here’s what this would look like for Bank A and for Bank B over 50 years (click on the image to expand it):
- Bank A — your $100 grows to $350 over the 50 years.
- Bank B — your $100 grows to $1,147 over the 50 years.
This is called “the power of compound interest” . . . or, as we now know, “the power of exponential growth” . . . !
And here is what that chart looks like over time.
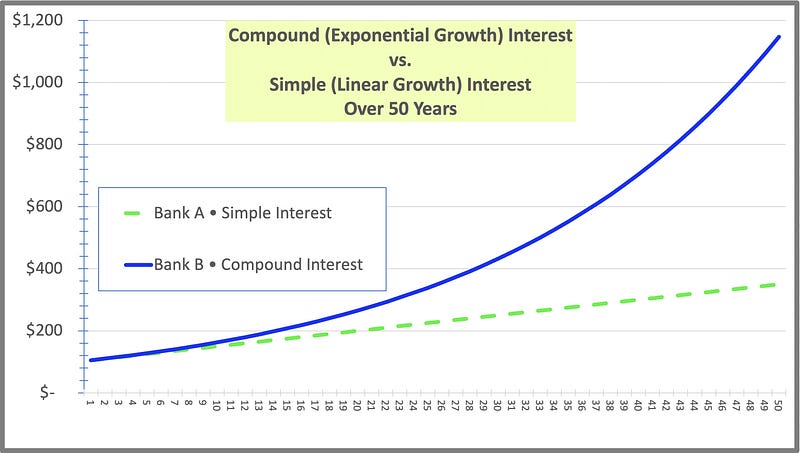
Exponential growth is a big deal, particularly when there are enough periods of time for the “compounding effect” to make real growth happen.
You can see that in the first 7 or 8 years (periods of time), the exponential curve doesn't grow too much beyond the straight line growth for simple interest.
But once the effects of exponential growth start to kick in, you see it really grow well beyond the simple interest, straight line case. And if we were to let this go on for another 100 or 200 years, we would see the exponential curve accelerate upwards and begin to look more like a line that is point straight up toward the sky.
The most important thing you can do when you’re dealing with an exponential curve — spot it EARLY!
There is a time early in an exponential curve where it really doesn’t look that much different than a straight line curve.
But there IS still exponential growth going on beneath the surface even when you can’t see it with the naked eye.
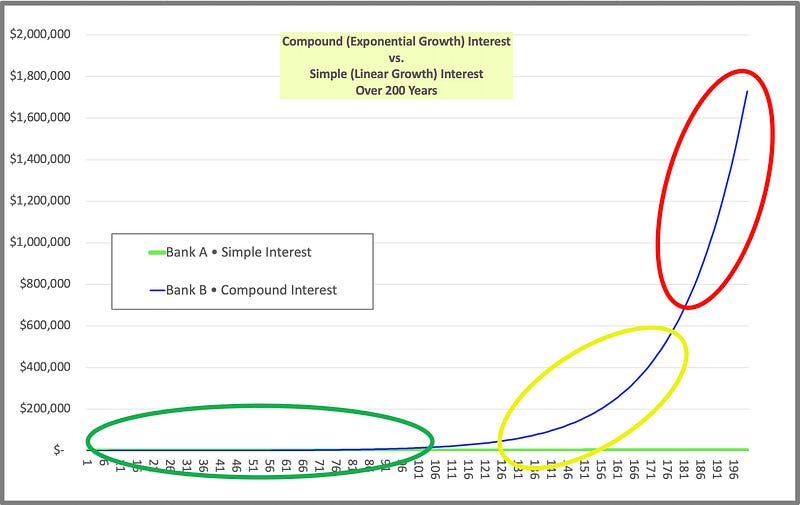
Let’s look at the same chart as above, but this time, I’ve extended it out another 150 years for a total of 200 years.
Look at the 3 areas I’ve circled on this chart with green, yellow, and red ovals.
Green Oval — before you can easily see on this chart that you’re dealing with an exponential curve.
Whatever the real-world thing is that we’re tracking with this chart, people are probably not seeing any effect of this thing in their day-to-day lives. It looks almost exactly like a straight and very flat line. The cancer cells are in your body and are starting to multiple, but there are still very few of them, and your body still feels normal and healthy.
When we are still in this green oval area, you have to know what you’re looking for and have good tools or data collection to catch it here. It can be done, but it takes some work and some expertise.
Yellow Oval — the elbow of the curve. Before you can easily see on this chart that you’re dealing with an exponential curve.
This is the part where the curve starts to turn up. You can see that something important is going on now. But you also don't have that much time to react before the curve starts to go straight up.
If this is
- a pandemic virus;
- the impact of carbon being pumped up into the atmosphere; or
- cancerous cells spreading in your body;
by the time you realize that the curve has started to turn up in what is NOW looking like exponential growth, you've lost most of the time that you originally had to react to this.
You are well on the way to getting totally screwed, all because you didn’t react in time.
That’s the bad news.
Here is worse news.
When you’re still in the Yellow Oval area, people who look at this data with a trained eye will see the curve and understand what might be going on.
However, non-technical people — which is probably at least 75% or 80% of the people in the general population — are going to be hard to persuade that they need to worry about this because it's not yet impacting them personally.
But wait — we still have to cover the “worst” news.
By the time you get to the RED oval area, it’s obvious that SOMETHING BIG is going on.
You don’t have to work hard at this point to convince the general population.
The exponential curve is now going STRAIGHT UP, and any reasonable person is going to see it. They will see it not just on a chart but also in their own lives.
This is the part where if you have cancer, it's already spreading throughout your body, and you're feeling incredibly sick from it.
If it’s Covid growth in the population, you’re seeing emergency rooms and Intensive Care Units getting overwhelmed with critically ill patients while the death count is accelerating upward.
You’ve lost probably at least 85% of the time you originally had to react and respond (the green and yellow oval areas on the chart), and the effects and impact of the thing you’re tracking have just gone into turbo mode up toward the stratosphere.
In other words, you’ve got zero time, and the situation is ALREADY out of control.
If it seems as though I'm making the situation sound incredibly dire, that's because it IS incredibly dire by the time the curve is going straight up.
So, how can we catch this earlier when we still have time and the ability to do something?
That will be the topic of the next article in this series.
If you have questions or comments about what we have covered so far, please leave them in the REPLY section below. I will do my best to address them in the rest of this article series.
Thank you for reading, subscribing, clapping, and sharing — I appreciate you sharing your time and attention!
Recent articles include:
Should It Be Up to Our Kids to Win the War Against Climate Change?
Life Expectancy vs. Healthcare Costs in the U.S.
The Samuel L. Jackson Approach to Dealing with Centrist Democrats Post-Roe and Pre-2022 Midterms
The Terrible Damage We Do . . . Voting Blue No Matter Who. • (Part 1/9) Centrist Democrats Do Not Reflect the Will of their Voters • (Part 1a/9) “Top-Down” Makes More Sense Than “Left-Right” Today in the U.S. • (Part 2/9) Voting Blue No Matter Who Just Gives Democracy a Great Big Screw • (Part 3a/9) Why Vote “Blue No Matter Who” If Centrist Dems Never Play to Win? • (Part 3b/9) Why Don’t Centrist Dems Show Up to Fight (Blue No Matter Who) • (Part 3c/9) Blue No Matter Who — Even When Centrist Democrats Suck at Their Jobs?
WTF! Will CHIPS Act Taxpayer Money Pay for Intel’s $130 Billion in Stock Buybacks and Dividends?
Did This Happen by Accident to 89% of America’s Stock Market Wealth?
Six Behavioral Barriers That Prevent You from Changing the Status Quo 1. Barnacles • 2–4. Caring Enough • 5. Smart Man’s Disease • 6. Blackballing
Want me to cover a topic? Please post suggestions in the comments, and I’ll use your input to help prioritize my writing and research.
If you appreciate my writing, please share it on social media.
Want unlimited access to all Medium articles? Become a member!
Again, thank you for reading, subscribing, clapping, and sharing — your time and attention are deeply appreciated!