
What can Option Prices tell us about the current and future state of the stock market?
Exploring Option Prices as a potential indicator of market sentiment and future risk. A quick study in Python.

Introduction
This is rather a quick blog post, but I thought it was worth sharing the current state of the options market, which may, in a way, reflect investors’ sentiment toward the entire financial market.
Options Basics-A Quick Overview
For those unfamiliar with options — these are essentially financial contracts that follow the price movements of the underlying asset (i.e. stock or bond), deriving its value and risk from it. Options allow to speculate on the future price of the underlying asset without owning it. Options are issued with various expiration dates and different strike prices, which represent the price levels of the underlying.
There are two types of options contracts: calls and puts.
A call buyer speculates that the price of the underlying will increase to or over a certain level (the strike price) within a specific time period (the expiration date). For instance, let’s assume that ABC stock is currently trading at $100. The buyer purchases a call at a strike price of $100 that expires within a month. This investor basically forecasts that the price will be above $100. Let’s assume that the stock price increased to $105. In this case the buyer can sell the call, as its value increased along with the price rise of the underlying, or can request a delivery of the 100 shares of the stock (one option equal to 100 shares of the stock)— whichever choice seems to be more profitable.
A put buyer speculates that the price of the underlying will decrease to or below a certain strike price between the purchase date and the expiration date. Once the underlying hits that certain level, the put buyer can either sell the put or exercise it which will cause delivery of a short stock position. The investor will need to close this short position by buying shares of this stock to realize a profit.
On the other hand, a put or call sellers speculate on the opposite moves than the buyer. When they sell an option, they receive a premium or income from the buyer, and this is the most profit they can make. In other words, the premium is the cost that the buyer pays for buying the option. The call seller believes that the price of the underlying will stay or not advance in a up direction — it will not breach a specific strike level within specified time frame. If that is the case, the seller will retain the premium. If the strike price is breached, the seller may be forced to deliver the shares to the buyer at that predetermined strike price, leaving the seller with the short stock position.
For instance, the ABC stock is currently at $100. The seller sells a call option at the strike price of $100 for $2 (the premium) — thinking that the underlying will not advance beyond this price point within some timeframe. If the price stays below $100, the seller made $200 ($2 x 100 shares of stock). If the stock increases to $105, the seller will be requested to deliver the stock at $100 to the buyer. In order to do that, the shares will need to be purchased in the market at the current price of $105. As a result, the seller is short 100 shares of the stock at $100, although the stock trades at $105, with an immediate loss of $500 ($5 x 100 shares). The seller retained the premium of $200 so the real loss is $300 ($500–$200). Similar mechanics apply to the put seller.
This is just a simple framework of how the options generally work, and more can be said, but this should suffice to understand the second part of this blog post.
Options Market-Current State
There is always some form of price disparity between the prices of equidistant calls and puts, and usually it has to do with the market volatility. If the market declines, the volatility increases and vice versa. The inverse relationship. The volatility is also about the speed of the price movement of the underlying. Mathematically, the speed should be unrelated to the direction of that move. If we factor in human emotions, though, the direction and speed can coincide. The fear of market crashing is a greater concern than the market experiencing a bull run. The fear causes the volatility to rise at a faster speed. Hence, this could explain the disparity.
However, often times this disparity is not as significant as it has been in recent days.
Let’s look at the options prices of the S&P500 index (SPY) using Yfinance library.
SPY closed at $420.07 on 11 March 2022:
SPY = yf.Ticker('SPY')SPY.history(period='1d')#as of 11 MAR 2022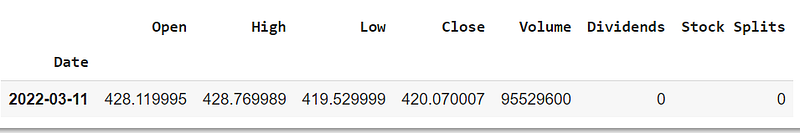
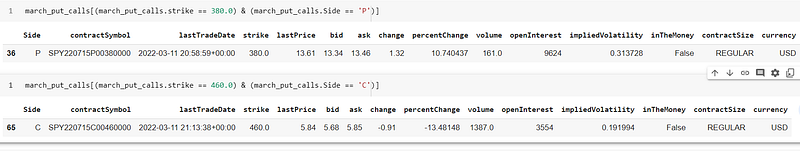
Now, let’s look at the available expiration dates for the SPY options:
SPY.options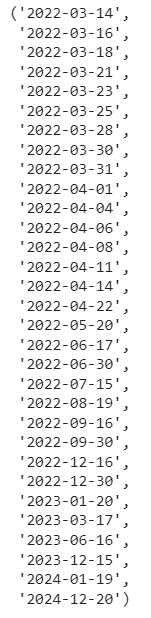
Let’s have a look at ‘2022–05–20’ and ‘2022–07–15’ expiration dates. I will look at the strike prices of puts and calls that are out of the money (OTM) 10% away from the current price. So roughly speaking, 10% of $420 is around $40, so I will examine $380 Put and $460 Call for each expiration date — both strikes being equidistant from the current price.
‘2022–05–20’ Expiration Date:
option = SPY.option_chain('2022-05-20')
march_calls = option.calls
march_calls['Side'] = 'C'
march_puts = option.puts
march_puts['Side'] = 'P'march_put_calls = pd.concat([march_calls, march_puts])first_column = march_put_calls.pop('Side')march_put_calls.insert(0, 'Side', first_column)march_put_calls[(march_put_calls.strike == 380.0) & (march_put_calls.Side == 'P')]march_put_calls[(march_put_calls.strike == 460.0) & (march_put_calls.Side == 'C')]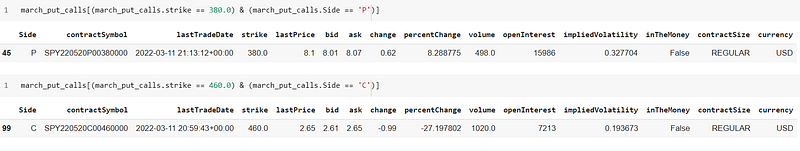
As we can see, the ‘lastPrice’ for $380 Put is $8.10, while for $460 Call is $2.65. The Put is 3x more expensive than the Call.
‘2022–07–15’ Expiration Dates:
The last price for $380 Put is $13.61, while for $460 Call is $5.84. The Put is 2.3x more expensive than the Call.
What about being 25% OTM away from the current price for this expiration date, that is $315 Put and $525 Call? Let’s check it out.
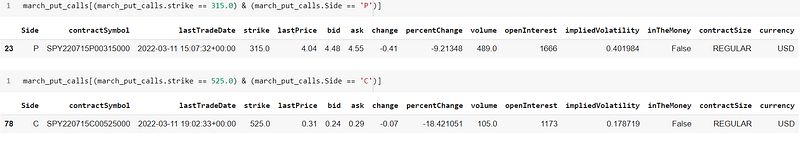
The Put appears to be 13x more expensive than the Call.
The OTM distance appears to have a significant impact on the price disparity between the equidistant puts and calls.
Options Market-Future State
What can these current call and put prices potentially tell us about the future of the stock market?
It appears that the investors see a bear market in the times ahead. However, you make your own conclusions based on the above observations.
Disclaimer: The information contained in this blog is strictly for educational and entertainment purposes only. This is also not an investment advice. All views expressed in this blog are my own and do not represent the opinions of any entity whatsoever with which I have been, am now, or will be affiliated.
Subscribe to DDIntel Here.
Visit our website here: https://www.datadriveninvestor.com
Join our network here: https://datadriveninvestor.com/collaborate