
Web scraping for financial statements with Python — 1
I replicated an Excel-based accounting work I used to spend hours on and this task can be done in seconds now.
Background
There are not many data science use cases for accounting. However, accounting jobs are one of the tedious categories that need to be automated. One of the tasks I used to do is to get financial statements for individual companies so that I can analyze their performance against the industry. Basically, I would search their names on Yahoo Finance and gather the key indicators on Excel.
Manipulating web data can be tricky sometimes especially when the website gets updated, but mastering these few steps will save you a tremendous amount of time in the future. Here is an example of getting financial statements from Yahoo Finance using Python.
Import libraries
Urlib.request is an open source library that parse content from a webpage. When you call that, you basically ask the website to get the data from that website. Here is more information if interested.
https://docs.python.org/3/library/urllib.request.html
Another library is called Beautiful Soup that makes reading data stored in XML format so much easier. XML is a format similar to HTML that has store values between tags. It looks kinda messy if you open it. Just like when you get the source code of a webpage.
import pandas as pd
from bs4 import BeautifulSoup
import urllib.request as ur
Processing
Here is a simple trick you can flexibly adjust the stock symbol and plug it into the URL link. It will come in handy later if you want to extract hundreds of company’s financial statements.
# Enter a stock symbol
index= ‘MSFT’
# URL link
url_is = ‘https://finance.yahoo.com/quote/' + index + ‘/financials?p=’ + index
url_bs = ‘https://finance.yahoo.com/quote/' + index +’/balance-sheet?p=’ + index
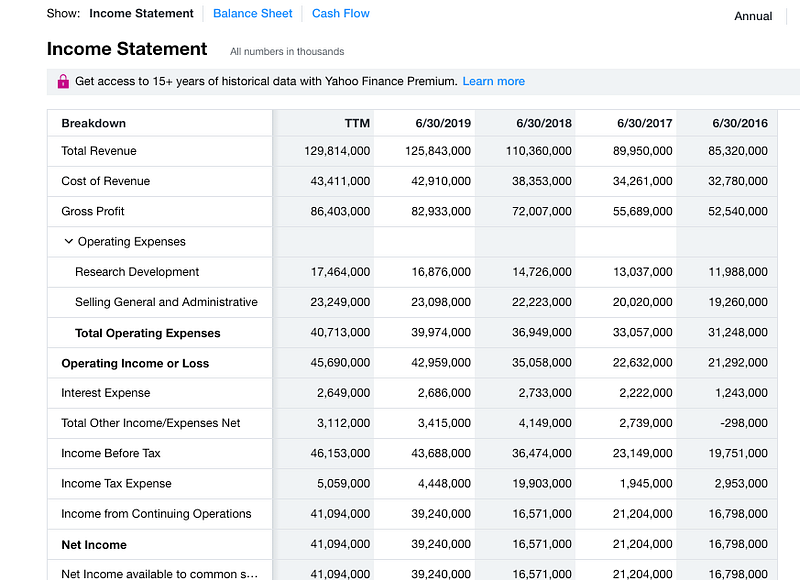
url_cf = ‘https://finance.yahoo.com/quote/' + index + ‘/cash-flow?p=’+ indexNow we have the URL link saved. If you manually open them on a Web browser, it will look like this.
Read the URL
Next, we just need to open the link and read it into a proper format called lxml. Simple enough.
read_data = ur.urlopen(url_is).read()
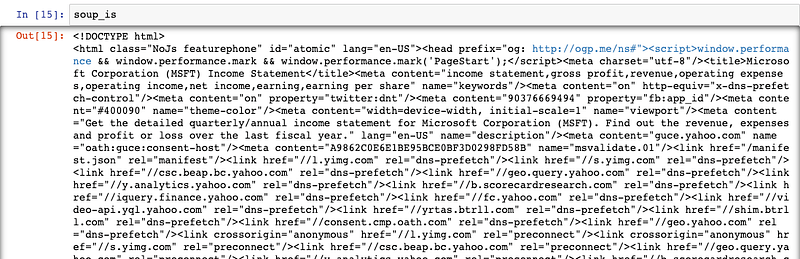
soup_is= BeautifulSoup(read_data,’lxml’)Well, if you open soup_is, it will look like a mess because the elements were originally in HTML format. All elements are systemically arranged in classes.
Data Manipulation
But how do know which classes the relevant data are stored in?
After a few searches, we know that they are stored in“div”, we can create an empty list and use a for loop to find all elements and append them to the list.
ls= [] # Create empty list
for l in soup_is.find_all(‘div’):
#Find all data structure that is ‘div’
ls.append(l.string) # add each element one by one to the list
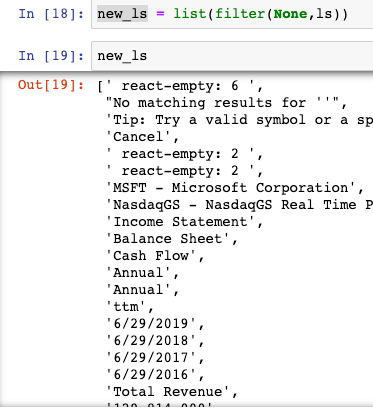
ls = [e for e in ls if e not in (‘Operating Expenses’,’Non-recurring Events’)] # Exclude those columnsYou will find that there are a lot of “none” elements in ls because not all “div” has an element. We just need to filter those out.
new_ls = list(filter(None,ls))
And now it looks like this.
If we take a step further and start reading the list starting in the 12th position.
new_ls = new_ls[12:]
Well, now we have a list. But how do we turn it into a data frame? First, we need to iterate 6 items at a time and store them in tuples. However, we want a list so that the pandas library can read it into a data frame.
is_data = list(zip(*[iter(new_ls)]*6))
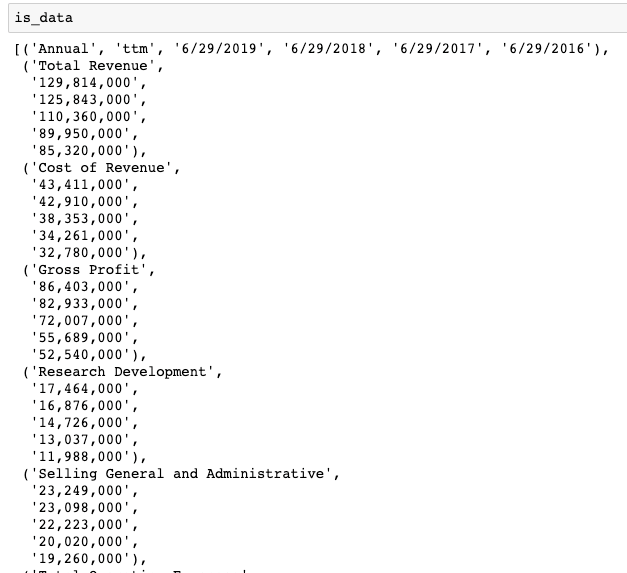
Perfect, that is exactly what we want. Now, we just have to read it into a data frame.
Income_st = pd.DataFrame(is_data[0:])
Data Cleaning
Sweet. It is almost done. We just need to read the first row as the column and the first column as the row index. Here are some clean-up.
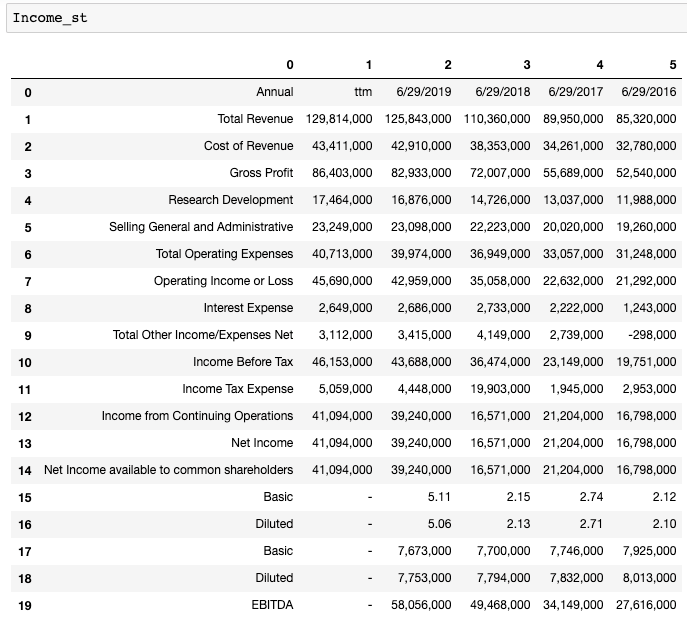
Income_st.columns = Income_st.iloc[0] # Name columns to first row of dataframeIncome_st = Income_st.iloc[1:,] # start to read 1st rowIncome_st = Income_st.T # transpose dataframeIncome_st.columns = Income_st.iloc[0] #Name columns to first row of dataframeIncome_st.drop(Income_st.index[0],inplace=True) #Drop first index rowIncome_st.index.name = ‘’ # Remove the index nameIncome_st.rename(index={‘ttm’: ‘12/31/2019’},inplace=True) #Rename ttm in index columns to end of the yearIncome_st = Income_st[Income_st.columns[:-5]] # remove last 5 irrelevant columnsAfter using the same techniques for the Income statement, balance sheet and cash flow, your Data Frames should look like the following.
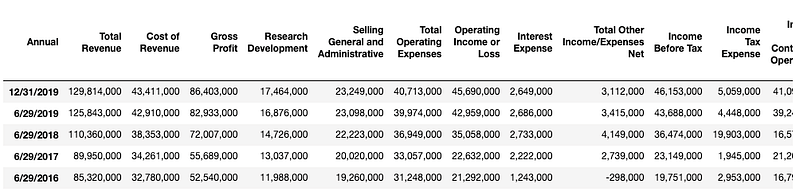
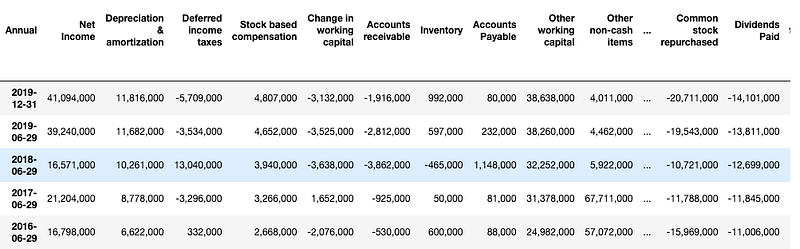
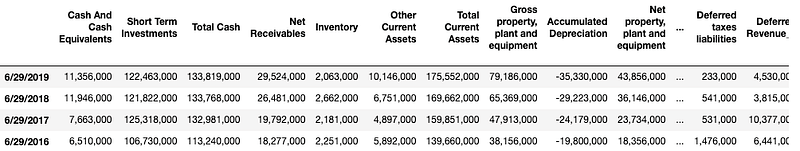
After doing a transpose on the DataFrames, DateTime is turned into a row index and the features become column names.
Here are some afterthought questions:
- How are the features correlated to the stock price of a company? How do you find out if they are correlated?
- If so, which time period of stock price are related to the features from our financial statements?
- What else can you do with the extracted data on developing algorithmic trading model?
Feel free to leave your answers and comments below at the response to check if you can come up with some unique answers.
Thank you for reading this article, feel free to share it if you find it useful. Here is another article on utilizing the new DataFrame and do further financial accounting analysis with Python.