
Wazuh & eBPF: Monitor TCP connections effectively

Network monitoring can be a powerful method for gaining insights into your server environment, but it often proves to be a complex and resource-intensive task. The Extended Berkeley Packet Filter (eBPF) technology solves these challenges by providing a range of pre-configured resources, including the bcc-tools package with its pre-built eBPF programs.
In this blog post, I will showcase the eBPF technology modifying the tcptracer utility to connect with Wazuh socket, which tracks the kernel functions responsible for connecting, accepting, and closing TCP connections. This modification not only offers improved functionality but also boasts minimal overhead due to its use of eBPF features.
Pre-requisites:
- BCC and bpfcc tools installed https://github.com/iovisor/bcc/blob/master/INSTALL.md
- Wazuh agent (Linux).
Wazuh agent & eBPF :
Download the WazuheBPFTCPTracer tool and configure it as a service in your Linux endpoint;
#hosted in my gist repo https://gist.github.com/elwali10
curl -so /home/vagrant/WazuheBPFTCPTracer https://gist.githubusercontent.com/elwali10/412c1176a3c24ccb84fba5fefa4e8503/raw/a974e26600503bf0a41842a4493dcdcd169dea09/WazuheBPFTCPTracer.py
#Make it executable
chmod go+x /home/vagrant/WazuheBPFTCPTracer

#Configure the tool as a service
#Create the service file
touch /etc/systemd/system/WazuheBPFTCPTracer.service

#Add below content
[Unit]
Description=WazuheBPFTCPTracer

[Service]
ExecStart=/home/vagrant/WazuheBPFTCPTracer

[Install]
WantedBy=multi-user.target

#Enable and start the service
systemctl daemon-reload
systemctl enable WazuheBPFTCPTracer
systemctl start  WazuheBPFTCPTracer
systemctl status  WazuheBPFTCPTracer
Wazuh Manager & Dashboard:
You should add the below decoders/rules and pipeline to get the events to the Wazuh dashboard.
- Decoders:
<decoder name="eBPFTCP">
 <prematch>TCP Connection:</prematch>
</decoder>

<decoder name="eBPFTCP1">
<parent>eBPFTCP</parent>
<regex>PID: (\d*) </regex>
<order>PID</order>
</decoder>

<decoder name="eBPFTCP1">
<parent>eBPFTCP</parent>
<regex>ProcessName: (\.*) </regex>
<order>ProcessName</order>
</decoder>

<decoder name="eBPFTCP1">
<parent>eBPFTCP</parent>
<regex>IPVersion: (\d*) </regex>
<order>IPVersion</order>
</decoder>


<decoder name="eBPFTCP1">
<parent>eBPFTCP</parent>
<regex>SourceAddress: (\d+.\d+.\d+.\d+) </regex>
<order>scrip</order>
</decoder>

<decoder name="eBPFTCP1">
<parent>eBPFTCP</parent>
<regex>DestinationAddress: (\d+.\d+.\d+.\d+) </regex>
<order>destip</order>
</decoder>

<decoder name="eBPFTCP1">
<parent>eBPFTCP</parent>
<regex>SourcePort: (\d*) </regex>
<order>SourcePort</order>
</decoder>

<decoder name="eBPFTCP1">
<parent>eBPFTCP</parent>
<regex>DestinationPort: (\d*) </regex>
<order>DestinationPort</order>
</decoder>- Rules:
<group name="eBPFTCP">

  <rule id="120000" level="3">
   <decoded_as>eBPFTCP</decoded_as>
   <description> TCP Connection Established </description>
  </rule>

</group>- Pipeline:
Must be added to the file /usr/share/filebeat/module/wazuh/alerts/ingest/pipeline.json located in the Wazuh manager.
{
  "description": "Wazuh alerts pipeline",
  "processors": [
    { "json" : { "field" : "message", "add_to_root": true } },
    {
      "geoip": {
        "field": "data.srcip",
        "target_field": "GeoLocation",
        "properties": ["city_name", "country_name", "region_name", "location"],
        "ignore_missing": true,
        "ignore_failure": true
      }
    },
    {
      "geoip": {
        "field": "data.destip",
        "target_field": "GeoLocation",
        "properties": ["city_name", "country_name", "region_name", "location"],
        "ignore_missing": true,
        "ignore_failure": true
      }
    },
    {
      "geoip": {
        "field": "data.win.eventdata.ipAddress",
        "target_field": "GeoLocation",
        "properties": ["city_name", "country_name", "region_name", "location"],
        "ignore_missing": true,
        "ignore_failure": true
      }
    },
    {
      "geoip": {
        "field": "data.aws.sourceIPAddress",
        "target_field": "GeoLocation",
        "properties": ["city_name", "country_name", "region_name", "location"],
        "ignore_missing": true,
        "ignore_failure": true
      }
    },
    {
      "geoip": {
        "field": "data.gcp.jsonPayload.sourceIP",
        "target_field": "GeoLocation",
        "properties": ["city_name", "country_name", "region_name", "location"],
        "ignore_missing": true,
        "ignore_failure": true
      }
    },
    {
      "geoip": {
        "field": "data.office365.ClientIP",
        "target_field": "GeoLocation",
        "properties": ["city_name", "country_name", "region_name", "location"],
        "ignore_missing": true,
        "ignore_failure": true
      }
    },
    {
      "date": {
        "field": "timestamp",
        "target_field": "@timestamp",
        "formats": ["ISO8601"],
        "ignore_failure": false
      }
    },
    {
      "date_index_name": {
        "field": "timestamp",
        "date_rounding": "d",
        "index_name_prefix": "{{fields.index_prefix}}",
        "index_name_format": "yyyy.MM.dd",
        "ignore_failure": false
      }
    },
    { "remove": { "field": "message", "ignore_missing": true, "ignore_failure": true } },
    { "remove": { "field": "ecs", "ignore_missing": true, "ignore_failure": true } },
    { "remove": { "field": "beat", "ignore_missing": true, "ignore_failure": true } },
    { "remove": { "field": "input_type", "ignore_missing": true, "ignore_failure": true } },
    { "remove": { "field": "tags", "ignore_missing": true, "ignore_failure": true } },
    { "remove": { "field": "count", "ignore_missing": true, "ignore_failure": true } },
    { "remove": { "field": "@version", "ignore_missing": true, "ignore_failure": true } },
    { "remove": { "field": "log", "ignore_missing": true, "ignore_failure": true } },
    { "remove": { "field": "offset", "ignore_missing": true, "ignore_failure": true } },
    { "remove": { "field": "type", "ignore_missing": true, "ignore_failure": true } },
    { "remove": { "field": "host", "ignore_missing": true, "ignore_failure": true } },
    { "remove": { "field": "fields", "ignore_missing": true, "ignore_failure": true } },
    { "remove": { "field": "event", "ignore_missing": true, "ignore_failure": true } },
    { "remove": { "field": "fileset", "ignore_missing": true, "ignore_failure": true } },
    { "remove": { "field": "service", "ignore_missing": true, "ignore_failure": true } }
  ],
  "on_failure" : [{
    "drop" : { }
  }]
}- Apply the new pipeline and decoders/rules:
Systemctl restart wazuh-manager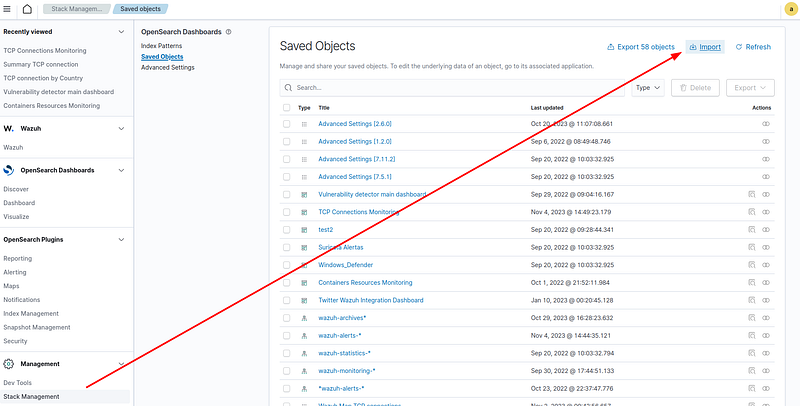
filebeat setup --pipelines- Import the dashboards:
Pre-made dashboards are located at https://github.com/elwali10/Wazuh-Kibana-dashboards/blob/main/WazuheBPFTCPConnections.ndjson; You need to download and import them into the Wazuh dashboard by navigating to StackManagement->Import
- Tests and results:
Performing any actions that establish TCP connections would be captured; as an example:
wget google.com
systemctl restart wazuh-agent
apt-get update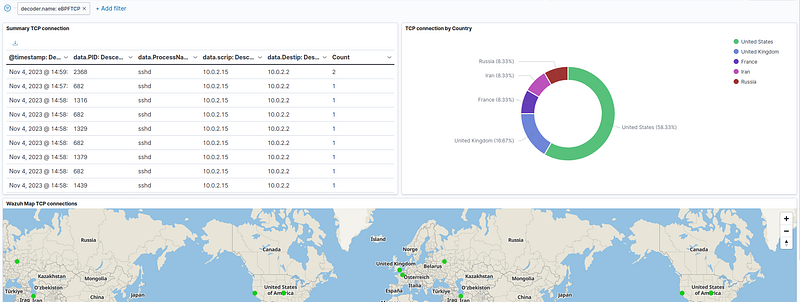
The enrichment from the pipeline allows getting the country names from the captured TCP connection events with very minimum resource consumption, thanks to the eBPF Capabilities.
Demo Video: https://www.youtube.com/watch?v=0X_v9HeqdLA&ab_channel=Elwalikarkoub


