Want to view trading signals from the magic formula? Check out our backtesting software.
Hi everyone, I am very excited to share a new feature which allows you to view the signals generated by your trading strategy in your backtest results.
This feature would bring greater transparency to your backtests allowing you to understand why certain stocks were selected by your investment strategy based on your trading signals.
What are trading signals?
A trading signal is an indicator used by an investor to determine whether to buy or sell a stock.
For example, a value investor could rely on the price to earnings ratio (PE ratio) to decide whether to buy or sell a stock. A low PE ratio would be a buy signal as the stock’s price is low relative to its earnings while a high PE ratio would be a sell signal.
There are many possible types of trading signals. Day traders and swing traders tend to look at technical indicators such as moving averages, volatility and other technical patterns in prices to form their trading signals. Investors with a long term view rely on fundamental data such as price to earnings ratio (PE ratio), return on equity (ROE) and profit growth as indicators to buy or sell a stock.
How do I combine trading signals?
Investors usually have multiple preferences when it comes to trading signals. For example, the Magic Formula by Joel Greenblatt relies on both the earnings yield and return on capital.
However, combining these signals together is not as simple as adding them together. This is because the potential range of values for the earnings yield are very different from return on capital. To make the earnings yield signal comparable with return on capital signal, we need to normalize the signals.
This normalization is done using the z-score where we adjust our signals using their mean and standard deviation. By normalizing both the earnings yield and return on capital, we can now add these 2 signals together to form an equally weighted overall signal.
This overall signal is used to rank our stocks so we can identify the best stocks to buy and the worst stocks to sell from our portfolio.
How do I view my trading signals?
To view your trading signals click on the results button in the top navigation bar and select a backtest result. If you have not created a backtest before check out this tutorial on how to create a backtest.
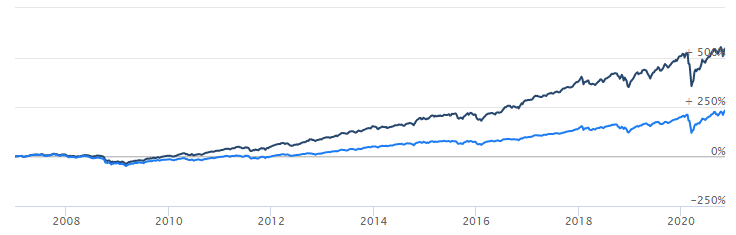
As an example, I chose a fundamentals backtest using the Magic Formula by Joel Greenblatt. The strategy selects the top 30 stocks every year with the lowest price to earnings ratio (PE ratio) and stocks with the highest return on equity (ROE) from a basket of 150 US stocks. This strategy does decently well against the S&P 500 with a higher annual return of 14.4% vs 9.0% and a lower volatility 19.3% vs 20.3%.
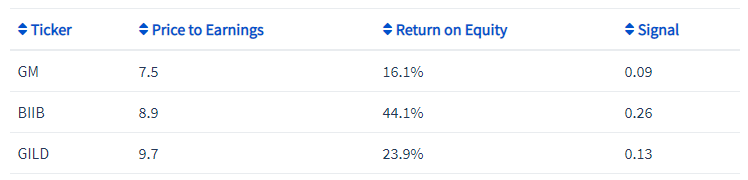
Scroll down to the signals section of the results page. Here, you will find a signals table with different trading signals in each column used by your backtest. The last column on the right shows the overall trading signal calculated from the z-scores of each individual trading signal.
You may sort the table based on a specific column by clicking on the blue column heading. This helps you to understand how your stocks would rank for each trading signal.
Sorting based on the price to earnings ratio (PE ratio) trading signal, we can see that in our portfolio, General Motors, Biogen and Gilead Sciences have the lowest price to earnings ratio (PE ratio).
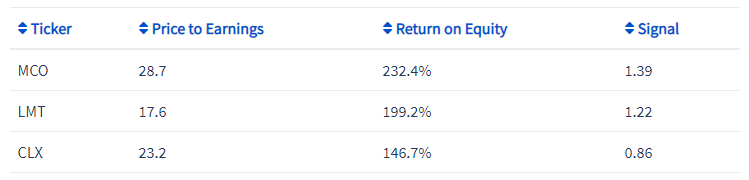
Sorting based on the return on equity (ROE) trading signal, Moody’s, Lockheed Martin and Clorox have the highest return on equity (ROE).
Conclusion
Backtesting software tends to be a black box for most people. We input our backtest details, run the backtest, and view the stocks that were selected by the backtester.
However, I think it is useful to know the actual signals used by the backtester and how the overall trading signals were calculated based on the z-score.
I hope this new signals table will help you understand why the backtester selected the respective stocks in your current portfolio and help you rank these stocks based on their trading signals.
If you would like to see this new feature in action, I invite you to create a fundamentals backtest using the magic formula.
Happy investing and may the odds be in your favour.


