
Statistics
Various Type of Central Tendency Measurement
The central tendency is beyond than mean, median, and mode
Statistics is the art of learning insights from the collected data. Organizing a team or a business model needs some input in form of data to summarize the meaningful information. A single value tells the behavior of the large volume of data. To identify the single value we measure the central tendency to represent an entire record. Statistics is a study of data in terms of variation and reduction of voluminous data in a re-presentable form.
In this article, we will study the various type of central tendencies with their advantages and disadvantages. The various measurements are shown below:
- Mean
- Median
- Mode
- Pythagorean means
- Arithmetic mean
- Geometric mean
- Harmonic mean
Everything is here just to get the information from these mean values only.
Mean
A simple mean is also called the arithmetic mean. It is just an average value of other values. It is a very simple calculation just add the all numbers and divide them by the total observation number.
Formula:
mean = sum(n(1)+n(2)…..n(i))/total numbers
Advantages:
- It is used to find the probability of average value.
Disadvantage:
- Affected by outliers value.
- Not used to calculate qualitative data.
- If some values are missing, calculating the mean is not so much useful.
Median
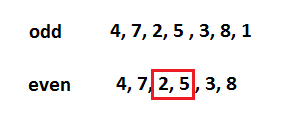
It is also used for calculating central values in records. The way to find the median value is to arrange the values in ascending order and find the middle value in the data.
If the records are odd then the middle is easy to find and if records are in even then take the average of the middle two numbers and find the mean of it. It will be the new median value.
Advantage:
- Easy to work with outliers.
- Can be calculated if any missing values in the record.
- Also used for qualitative data.
- Good with an outlier in data.
Disadvantage:
- Just for even numbers it is not getting exactly.
Mode
To find the central tendency in mode is to find the observation that occurs most of the time in the record.
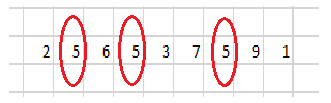
If we see in the image above the “5” occurs the most so, we can say that 5 is the central measure value in the data. Well, this data is small that's why we can easily observe the most occurrence value. If the data is very big then arrange it in ascending order and find the number or we can take the help of programming to find the count number of unique values in the data.
Advantage:
- It is easily detected.
- Can be calculated if any missing values in the record.
- Also used for qualitative data.
- Good with an outlier in data.
Disadvantage:
- Sometimes we get more than two modes.
Pythagorean means
These means are studied by Greek mathematicians in proportions. Mainly there are three types of mean in this Pythagorean.
- Arithmetic mean
This mean is the same we studied above.
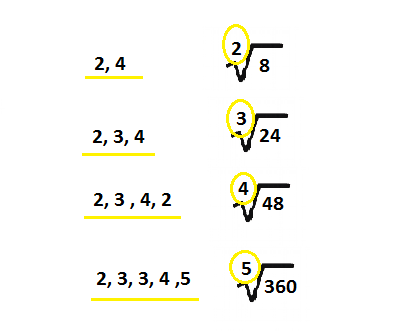
2. Geometric mean
This mean is useful when there is a small data. The calculation of this mean is to take the product of each number and take the roots of this product number. For example, for two numbers take a square root of their product, for three numbers take a cube root of their product, etc.
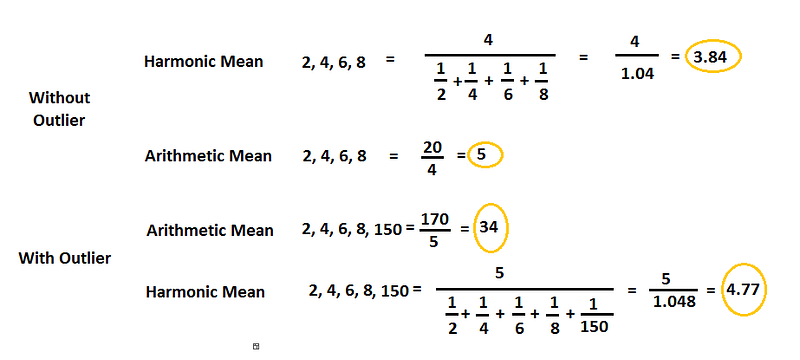
3. Harmonic mean
The harmonic mean is another method to measure the central tendency of the data. The calculation of harmonic mean is to find the reciprocal of the averaged reciprocal of values. Let me clear this with the example below:
These are some central tendency values used in daily life problems. There are many more measurements of means according to powers, functions, etc. Form example, power means, f-mean, truncated mean, etc.
Conclusion:
The measurement of central value gives very good information from the data. We can use statistical analysis of data in pattern and visualization for business growth.
I hope you like the article. Reach me on my LinkedIn and twitter.
Recommended Articles
2. Python Data Structures Data-types and Objects
4. Basics of Time Series with Python
5. NumPy: Zero to Hero with Python
6. Fundamentals of series and Data Frame in Pandas with python