
Value Investing Dashboard with Python Beautiful Soup and Dash Python
An Overview of Web Scraping with a Quick Dash Visualization for Value Investing
Problem Statement
“So I usually searched the stocks on the trading website like SGX or Yahoo Finance, and copy pasted the relevant dataset one by one into my Excelsheet”
“There should be a quick access to the most relevant stocks information for me to make buy/sell decisions”
I still remembered on how my friend boasted on his hard earned excelsheet of different stocks ratios that he copy pasted from SGX (Singapore Stocks Exchange). Out of sheer determination, he duplicated the data one by one, juggling through hundreds of views and clicks to retrieve stocks information and dumped to excelsheet where he kept all of the formulas manually.
The whole process seems comical as there were lots of manual scrolls and clicks to extract seemingly large number to make buy/sell decisions. This problem inspired me to build my own tool to automate the extraction and process relevant financial ratios quickly.
Disclaimer: This disclaimer informs readers that the views, thoughts, and opinions expressed in the text belong solely to the author, and not necessarily to the author’s employer, organization, committee or other group or individual. References are picked up from the list and any similarities with other works are purely coincidental
This article was made purely as the author’s side project and in no way driven by any other hidden agenda.
Solution: Web Scraping and Dashboard Visualization
In this project, I would like to present to you a dashboard that you could use to quickly gain important financial feedback. Users only need to input the stocks ticker (such as GOOG or MSFT), and the application will handle all of the necessary critical ratios and calculations of Future Price. Once the information is retrieved from MarketWatch, the application will crunch the number into a predefined subset of values. The end result will showcase whether the users should buy/sell certain stocks depending on user defined marginal value and market price
This application aims to remove the needs of users to even access stocks market website such as SGX, Yahoo/Google Finance, they could use our application as an one stop for all critical stocks information, basic analysis and warning signs for users to learn.
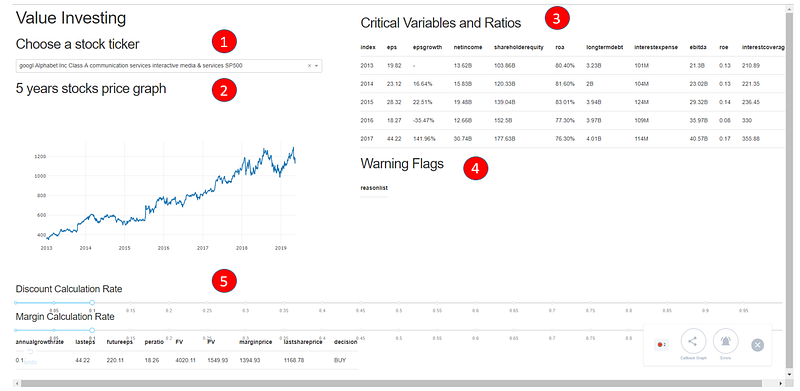
Following are the application demo and notice how the screens will update based on user inputs stock ticker:
Update: 27th June
I have cleaned up and deployed the application. Please try it out here!
Purpose and Github Code
The purpose for this Proof Of Concepts (POC) was created as a part of investments side project that the I am currently managing. Thinking to invest not long after my graduation, I was inspired by Sean Seah Book — Gone Fishing with (Warren Buffett). This book had inspired me to create my own tool for value investing. The goal of this application is to help you retrieve and display the right financial insights quickly about a certain company ticker.
In the POC, I used Beautiful Soup as the Web Scraping Tool, Pandas data-reader API to get the financial stocks price, and finally Python with Flask/Dask for Web Application Framework. The Github Code is located below.
Feel free to clone the repo and contribute whenever you have time.
The Scope of Project
There are 5 processes that I would like to highlight for this application:
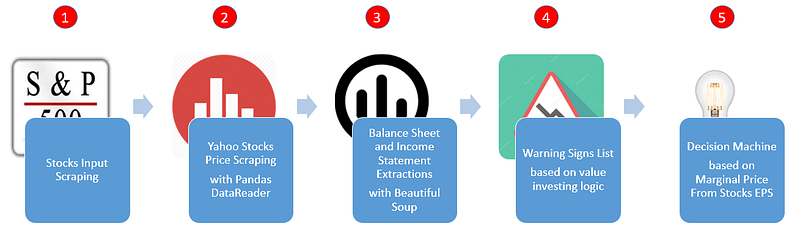
Let us try to break it down one by one
Stocks Input Scraping
In this list, we are going to extract lists of the stocks with their tickers, e.g: Google (GOOG) or Microsoft (MSFT). We are going to extract these information from 3 sources:
Getting SP500 stocks info from wikipedia
The S&P 500 stock market index, maintained by S&P Dow Jones Indices, comprises 505 common stocks issued by 500 large-cap companies and traded on American stock exchanges (including the 30 companies that comprise the Dow Jones Industrial Average), and covers about 80 percent of the American equity market by capitalization. — Wikipedia
To extract that, we will use the link to the stocks indices.
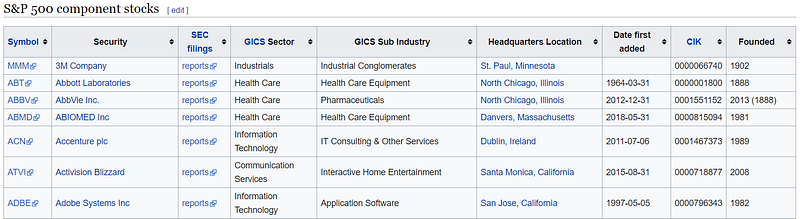
You can extract this table using web scraping library such as Beautiful Soup 4. Feel free to refer the article here.
First we will create the pass the URL Link onto Beautiful Soup. This will extract some of the values as a soup
import requestsresp = requests.get('http://en.wikipedia.org/wiki/List_of_S%26P_500_companies')
soup = BeautifulSoup(resp.text, 'lxml')This soup object will hold HTML Text which you could extract by running the following command.
for row in table.findAll('tr')[1:]:
        ticker = row.findAll('td')[0].text
        security = row.findAll('td')[1].text
        gics_industry = row.findAll('td')[3].text
        gics_sub_industry = row.findAll('td')[4].text

        tickers.append(ticker.lower().replace(r"\n", " "))
        securities.append(security)
        gics_industries.append(gics_industry.lower())
        gics_sub_industries.append(gics_sub_industry.lower())
This command will find the table then iterate every row to retrieve the data for each column. The extractions will be carried forward into a list, which is later dumped into a dictionary list of key and value pair.
# Create a list of dict based on tickers and labels
dictlist = []
for index, row in stocks_info_df.iterrows():
     dictlist.append({'value':row['tickers'], 'label':row['labels']})
return dictlist
Getting Russell stocks info
Getting the Russell Stocks info is even more straightforward as the data is openly available. Feel free to refer to this for existing Russel Stocks Repository. We can just read it using pandas readcsv method.
dfrussel=pd.read_csv('C:/Users/vintatan/Desktop/Investment/RussellandData.csv',index_col='Symbol')Adding own list of stocks info
For any of the tickers not existing in either SP200 or Russell List, we could manually passed our stocks value and label into a dictionary list.
# self append
def save_self_stocks_info():
    print("Adding own list of stocks info")

    dictlist = []

    dictlist.append({'value':'sq', 'label':'SQ Square SA'})
    dictlist.append({'value':'kbsty', 'label':'Kobe steel'})
    dictlist.append({'value':'NESN', 'label':'Nestle'})
    dictlist.append({'value':'BN', 'label':'Danone'})
Conclusion
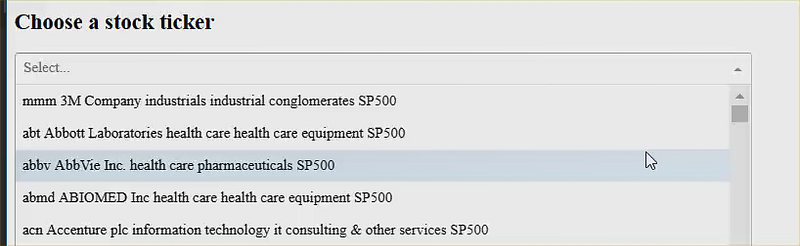
From these methods of extracting 3 different sources, you might realize that I am passing a list of dictionary object. This is due to the formatting required for Dash Combo Box Inputs. Please refer to Dash Visualization tool here
dcc.Dropdown(
    id='my-dropdown',
    options=save_sp500_stocks_info()+save_self_stocks_info(),
    value='coke'
),
Yahoo Stocks Price Scraping with Pandas DataReader
We will use Pandas-data Reader to generate the stocks price based on Yahoo. In here, we passed 4 parameters into the web.DataReader
The ticker, in this case it will put MSFT, GOOG, etc
The data_source which is Yahoo
The start time, which is from January 1st 2013.
The end time, which is now.
Once we have generated stockpricedf, we returned a dictionary with key ‘data’ and return the date as the x axis while the closing price as the y axis.
    stockpricedf = web.DataReader(
        selected_dropdown_value.strip(), data_source='yahoo',
        start=dt(2013, 1, 1), end=dt.now())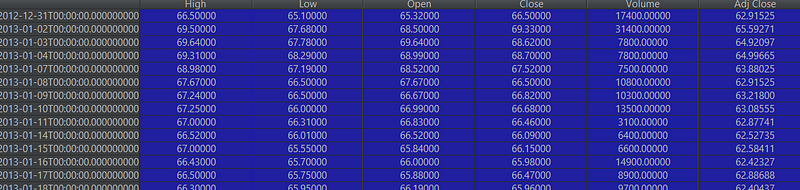
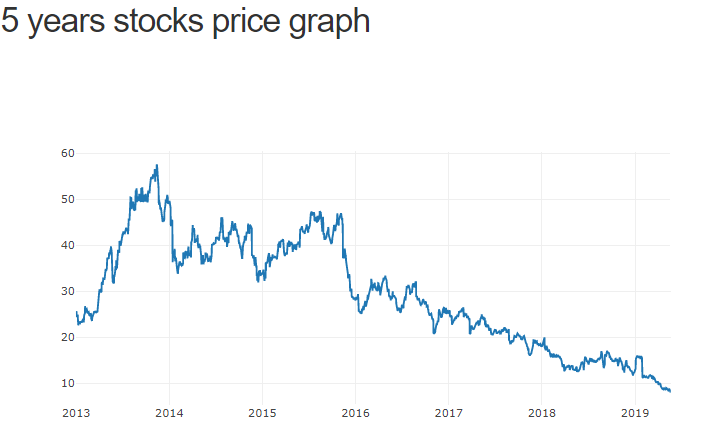
This will be translated into the price chart as you see here
    return {
        'data': [{
            'x': stockpricedf.index,
            'y': stockpricedf.Close
        }]
    }
Balance Sheet and Income Statement Extractions with Beautiful Soup
In this subtopic, we will try to extract the important ratios and display them as Dash Table. The followings are the ratio we are interested in:
EPS (Earning Per Share) is the portion of a company’s profit allocated to each share of common stock
ROE (Return of Equity) is a measure of financial performance calculated by dividing net income by shareholders’ equity
ROA (Return of Assets) is an indicator of how profitable a company is relative to its total assets
Long Term Debt would include company bond issues or long-term leases that have been capitalized on a firm’s balance sheet
Total Income would symbolize the income that the company made
Debt to Equity is used to evaluate a company’s financial leverage
Interest Coverage Ratio is used to determine how easily a company can pay their interest expenses on outstanding debt
These definitions come from Investopedia. Please find further details below
We will use Market Watch Balance Sheet and Income Statements links and assign them to variables. Note here that the ticker refers to the company’s ticker. Therefore the link to Apple Income statement is https://www.marketwatch.com/investing/stock/AAPL/financials and the and to Apple Balance Sheet is https://www.marketwatch.com/investing/stock/AAPL/financials/balance-sheet
urlfinancials = 'https://www.marketwatch.com/investing/stock/'+ticker+'/financials'
urlbalancesheet = 'https://www.marketwatch.com/investing/stock/'+ticker+'/financials/balance-sheet'
text_soup_financials = BeautifulSoup(requests.get(urlfinancials).text,"lxml")
text_soup_balancesheet = BeautifulSoup(requests.get(urlbalancesheet).text,"lxml")Similar to extracting the company tickers, we also used Beautiful Soup to identify the ratios from the financials and balance sheets url. We will extract them with by going through all of the siblings of attributes with label texts as the indicators.
# Income Statement
for title in titlesfinancials:
    if 'EPS (Basic)' in title.text:
        epslist.append ([td.text for td in title.findNextSiblings(attrs={'class': 'valueCell'}) if td.text])
    if 'Net Income' in title.text:
        netincomelist.append ([td.text for td in title.findNextSiblings(attrs={'class': 'valueCell'}) if td.text])
    if 'Interest Expense' in title.text:
        interestexpenselist.append ([td.text for td in title.findNextSiblings(attrs={'class': 'valueCell'}) if td.text])
    if 'EBITDA' in title.text:
        ebitdalist.append ([td.text for td in title.findNextSiblings(attrs={'class': 'valueCell'}) if td.text])


# Balance sheet
titlesbalancesheet = text_soup_balancesheet.findAll('td', {'class': 'rowTitle'})
equitylist=[]
for title in titlesbalancesheet:
    if 'Total Shareholders\' Equity' in title.text:
        equitylist.append( [td.text for td in title.findNextSiblings(attrs={'class': 'valueCell'}) if td.text])
    if 'Long-Term Debt' in title.text:
        longtermdebtlist.append( [td.text for td in title.findNextSiblings(attrs={'class': 'valueCell'}) if td.text])
We will populate the extracted values into a separate data frame.
df= pd.DataFrame({'eps': eps,'epsgrowth': epsgrowth,'netincome': netincome,'shareholderequity': shareholderequity,'roa':
              roa,'longtermdebt': longtermdebt,'interestexpense': interestexpense,'ebitda': ebitda},index=[2013,2014,2015,2016,2017])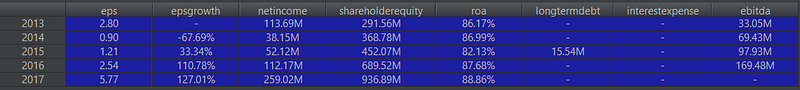
This dataframe will be dumped into the dash table object as below
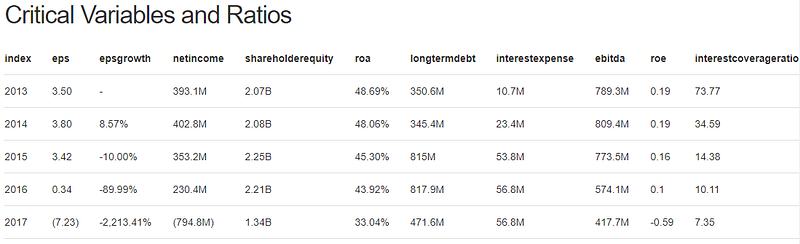
Warning Signs List based on value investing logic
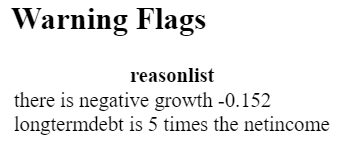
We will then create the eligibilitycheck.py to iterate through these rules and identify some possible risks given the ratios extracted.
Given list of the companies, find out the feasibility to invest Been in market minimal 10 years Have the track records (EPS per year) Have efficiency (ROE > 15%) — Net income / shareholder equity Determine manipulation (ROA > 7%) — Net income / Total Asset Have small long term debt (Long term debt <5* total income) Low Debt to Equity Ability to pay interest: (Interest Coverage Ratio >3) — EBIT / Interest expenses
Using the generated dataframe above, we will retrieve a list of warnings
Decision Machine based on Marginal Price From Stocks EPS
We will then create the last of our steps by deriving whether the users should buy from the expected Future Values and the marginal values from users’ defined parameters. Following are the steps that were implemented in futurepricing.py
Decision making from each company in terms of return rate given the value investing methodology Find EPS Annual Compounded Growth Rate Estimate EPS 10 years from now Estimate stock price 10 years from now (Stock Price EPS * Average PE) Determine target by price today based on returns(discount rate 15%/20%) Add margin of safety (Safety net 15%) Buy if market price is lower than the marginal price Sell if market price is higher than the marginal price
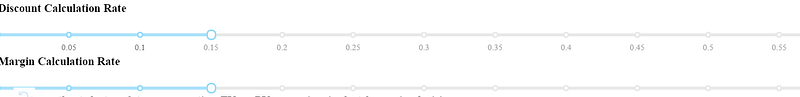
From here, we will generate the following parameters derived from the logic of Sean Seah’s book.
In this functionality, we will allow users inputs such as discount rate and marginal rate. Discount rate indicated predicted inflation over the period of 5 years, margin calculation rate is the toleration for error. You add on additional safety net in the case of calculation error. The more the margin calculation rate, the more risk averse you are or vice versa.
dfprice['peratio'] = findMinimumEPS(stockpricedf,financialreportingdf)

dfprice['FV'] = dfprice['futureeps']*dfprice['peratio']


dfprice['PV'] = abs(np.pv(discountrate,years,0,fv=dfprice['FV']))
dfprice['marginprice'] = dfprice['PV']*(1-marginrate)
dfprice['lastshareprice']=stockpricedf.Close.tail(1).values[0]

dfprice['decision'] = np.where((dfprice['lastshareprice']<dfprice['marginprice']),'BUY','SELL')
This will generate data frame with the following data and decision (buy/sell)

In this case, based on eps growth and pe ratio, you could find the future price and present price valuations. Added with discount rate and margin rate, you will get margin price. Since margin price is less than last share price, we could assume that the stocks is currently overpriced even given the tolerated error rate. Hence the Sell decision. The opposite also worked for the Buy decision
A very simple logic, but a powerful one to leverage on your stocks purchases. Of course the caveat is that you should do your due diligence on the qualitative analysis before purchasing the stocks.
Result
After developing this tool, I feel the need to test it out. Therefore in 2017, I decided to buy some stocks using the screenings from this tool.
Buying Skechers
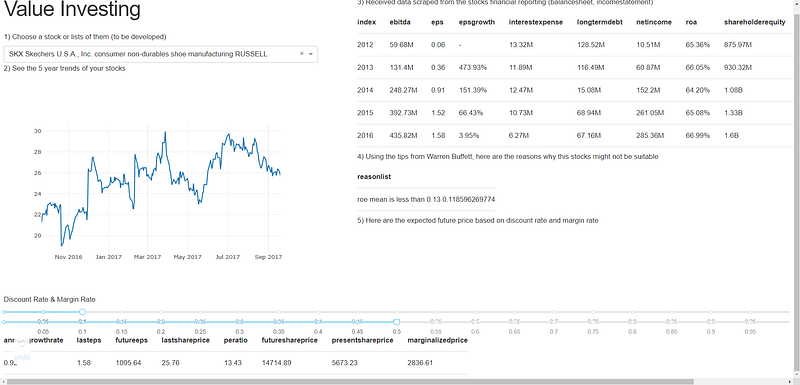
As you could view here, the application marked Skechers as an abnormally high marginalized price. This means that given 10% discount rate assumption (from economic instability or inflation) and 50% marginal rate assumption (from degree of potential error), we still work the marginal share price to be very high — our valuated price.
Further glimpse at eps growth shows the fast growing nature of Skechers from 2012–2016. However, at the same time, if you view the long term debt ratio, Skechers’ debt had reduced or stabilized. Overall, increasing revenue, high growth, and low long term debt is one of the biggest reason why I bought Skechers. Over one and half a year, I have received 34.55% stocks price increase
Buying Qualcomm
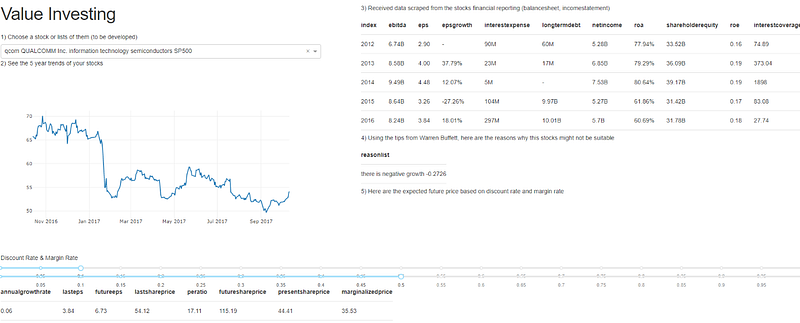
In 2017, I received news of Qualcomm being in dispute with Apple. This made the stocks dropped into 44. Hence, I tried to use the tool to see if I could extract the information quickly and analyze quantitatively. After taking a quick look, I realized that Qualcomm gave me a high future value as $115 given the pe ratio and the annual growth rate. Even when I put 50% as margin rate (I am a very risk averse guy), I could see that the marginal price still fared comfortably from the present share price. As there are not much warning signs and increase in long term debt except for one year negative growth, I bought Qualcomm. Over one and half a year, I have received 62.87% stocks price increase.
Buying Gamestop
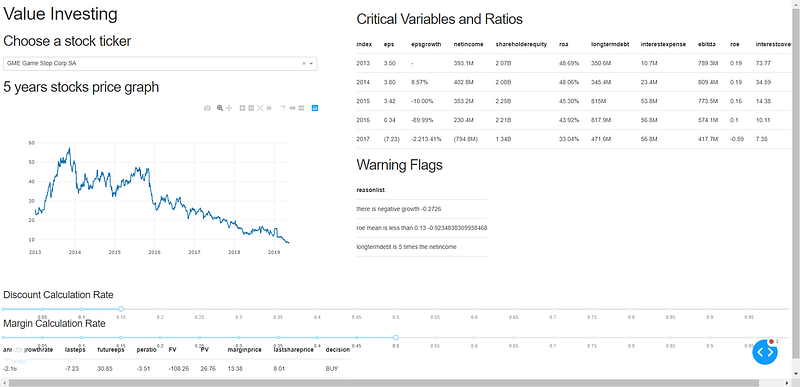
Gamestop is my newest investment I made with the value investing dashboard. It is considered a cigarette butt investing as this is a stocks in declining growth that no investors want — hence, cigarette butt (get it?! Haha). At the Warning Flags, three warnings were present: that there are negative growth, high long term debt, and small ROE. However, if you take a look at the decision at the bottom: the application remarked it as Buy. The reason why is that although the stocks is dropping in lieu with the negative growth, the market valuate the stocks too low: people are too afraid to invest in GameStop. The rate of declining business is lower than the rate of declining market’s sentiment. As you could see, even when I put margin rate for 50%, I still saw the margin price ($13) to be higher than the share price ($8). For that reason, I bought Gamestop expecting for investors to realize this gap, while at the same time, hoping for buyouts. Up to now, I am losing 7.58%.
Holding 18% Returns of Portfolio
Using this application, I made it a point to first screen, purchase and hold the stocks. Currently, some of my successful purchases included: Keppel Reits DC, CSE Global Limited, Qualcomm, and Skechers. With some screened stocks such as Skechers and Qualcomm to be the high performers up to date.
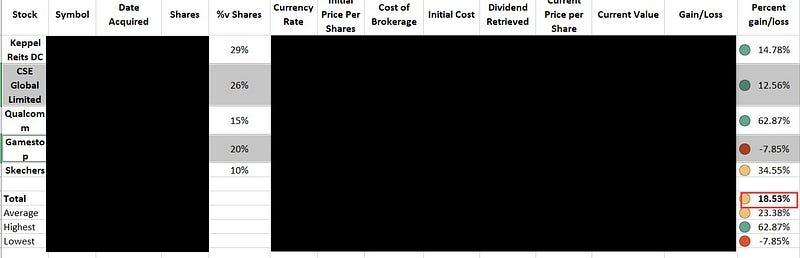
As you could see, I am currently managing working portfolio that generated up to date returns of 18% after 1 and a half year of holding. If dividends are included, then the returns are estimated to be 22%. Although this is a great return after a year and not much, this is still not long enough to prove the app’s usefulness. Feel free to try it out and comment below.
Furthermore, I would like to further highlight the important caveat: do your due diligence.
You should still evaluate your stocks by asking about the following qualitative assessment:
Advantages in business (product differentiation, branding, low price producer, high switching cost, legal barriers to entry)
Ability of foolhardy management (even a fool can run)
Avoid price competitive business. Understand how the business makes revenue.
Lastly, I hope this application or at least my little piece of investing journey could inspire you to innovate. Feel free to refer the codes for better understanding on how I crunch the number to derive buy/sell action. Then, please feel free to fork and contribute if there are further improvements you would like to work on.
Everything is up for grab for free!! Please contribute to make it the best open source value investing tool.
Conclusion and Future Work
This project gave me the opportunities to solve a practical and relevant problem, which many of my finance friends seem to face. There are many functionalities we could add to improve the user experience, but for now, this application has successfully handled the mentioned core problem of extracting relevant financial ratios and information for preliminary stocks screening.
From this project, I also learnt many of basic finance theories, which I could implement to valuate stocks. I am not an expert at finance and I bet you probably know way better than me. Therefore, feel free to improve on the solutions as you see fit. My contact detail is below if you would like to say hi or have a chill discussion :).
Acknowledgments
I would like to thank you my fellow Accountancy and Finance friends who inspired me to build this tool. I really enjoyed learning a bunch of finance terms from them and used that to tackle real life problems that they have been encountering.
Finally…
Whew… That’s it, about my idea which I formulated into writings. I really hope this has been a great read for you guys. With that, I hope my idea could be a source of inspiration for you to develop and innovate.
Please reach out to me via my LinkedIn and subscribe to my Youtube Channel
Comment out below for suggestions and feedbacks.
Happy coding :)