
Value Charts — Another Way to Trade the Markets
Creating Value Charts in Python

Value does not have to be exclusive to fundamental analysis. We can also, create a value chart in technical analysis which acts as a reversal indicator.
Medium is a hub to interesting reads. I read a lot of articles before I decided to start writing. Consider joining Medium using my referral link (at NO additional cost to you).
Creating the Value Charts
Value charts were first introduced by Mark Helweg and David Stendahl in their 2002 book — Dynamic Trading Indicator. The main idea was to enhance the relative strength which has many limitations due to the fact that it is unbounded.
We typically use them in a different panel and treat them as indicators. We need two concepts to create the value chart:
- Moving averages.
- Extreme range.
We first start by calculating the moving average of the open, high, low, and close columns. We can use a 20-period moving average but this is totally up to you and to the analyzed underlying.
def adder(Data, times):

    for i in range(1, times + 1):

        new = np.zeros((len(Data), 1), dtype = float)
        Data = np.append(Data, new, axis = 1)

    return Data
def deleter(Data, index, times):
for i in range(1, times + 1):
Data = np.delete(Data, index, axis = 1)
return Datadef jump(Data, jump):
Data = Data[jump:, ]
return Datadef ma(Data, lookback, close, where):
# Adding a column
Data = adder(Data, 1)
for i in range(len(Data)):
try:
Data[i, where] = (Data[i - lookback + 1:i + 1, close].mean())
except IndexError:
pass
# Cleaning
Data = jump(Data, lookback)
return DataThen, we calculate the extreme range which is the difference between the high and low of every time step. Next, we need to calculate the volatility unit which is simply a 5-period moving average of the last calculation multiplied by 1 / the selected period, in this case, it is 5.
Finally, we use the below formula for the OHLC data to create the value chart.
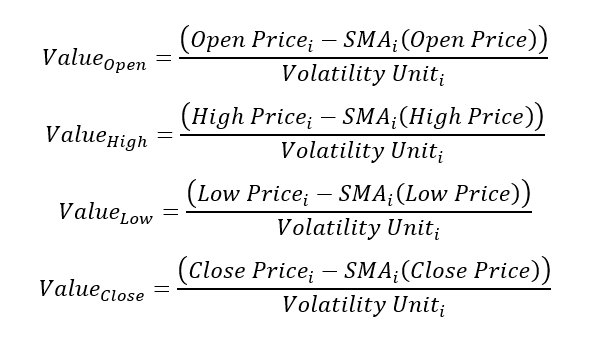
This gives us the following chart.
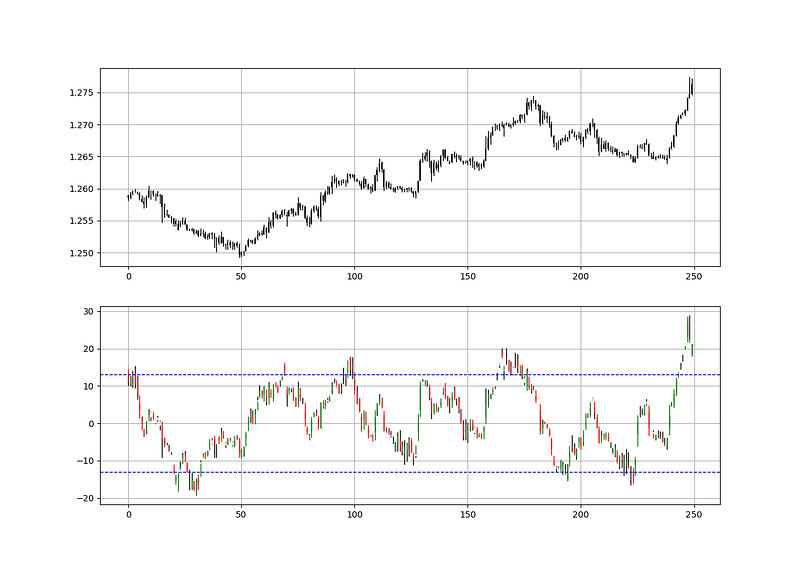
We generally watch for subjective barriers for reversal moves. They mainly depend on the market, therefore,
def value_chart(data, lookback_ma, lookback_vol, open_price, high_price, low_price, close_price, where):

    # calculating the moving average
    data = ma(data, lookback_ma, open_price, where)
    data = ma(data, lookback_ma, high_price, where  + 1)
    data = ma(data, lookback_ma, low_price, where   + 2)
    data = ma(data, lookback_ma, close_price, where + 3)

    # calculating the volatility unit
    data = adder(data, 5)
    data[:, where + 4] = data[:, high_price] - data[:, low_price]
    data = ma(data, lookback_vol, where + 4, where + 5)
    data[:, where + 5] = data[:, where + 5] * (1 / lookback_vol)

    # calculating the value chart
    for i in range(len(data)):

        data[i, where + 6] = (data[i, open_price] - data[i, where]) / data[i, where + 5]
        data[i, where + 7] = (data[i, high_price] - data[i, where + 1]) / data[i, where + 5]
        data[i, where + 8] = (data[i, low_price] - data[i, where + 2]) / data[i, where + 5]
        data[i, where + 9] = (data[i, close_price] - data[i, where + 3]) / data[i, where + 5]

    # cleaning
    data = deleter(data, where, 6)

    return data
Knowledge must be accessible to everyone. This is why, from now on, a purchase of either one of my new books “Contrarian Trading Strategies in Python” or “Trend Following Strategies in Python” comes with free PDF copies of my first three books (Therefore, purchasing one of the new books gets you 4 books in total). The two new books listed above feature a lot of advanced indicators and strategies with a GitHub page. You can use the below link to purchase one of the two books (Please specify which one and make sure to include your e-mail in the note).
Using the Value Charts
Value charts are used the same way as other contrarian indicators such as the RSI even though the name of barriers differ as with value charts, we tend to say overvalued/undervalued and with other indicators, we tend to say oversold/overbought.
The strategy is quite simple but very modifiable. For a value chart(20, 5):
- A long (Buy) signal is generated whenever the indicator hits -13.
- A short (Sell) signal is generated whenever the indicator hits 13.
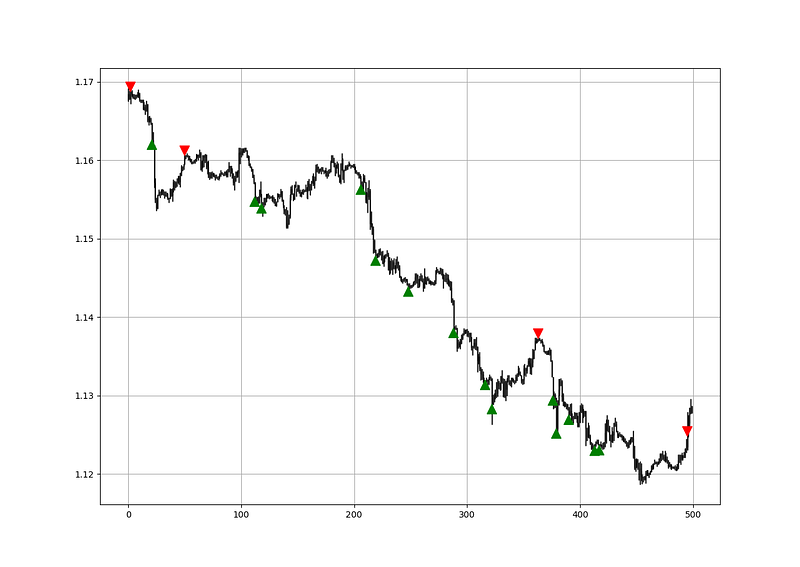
def signal(data, high_value, low_value, buy_column, sell_column):

    data = adder(data, 2)

    for i in range(len(data)):

        if data[i, low_value] < -13 and data[i - 1, low_value] > -13:

            data[i, buy_column] = 1

        if data[i, high_value] > 13 and data[i - 1, high_value] < 13:

            data[i, sell_column] = -1

    return data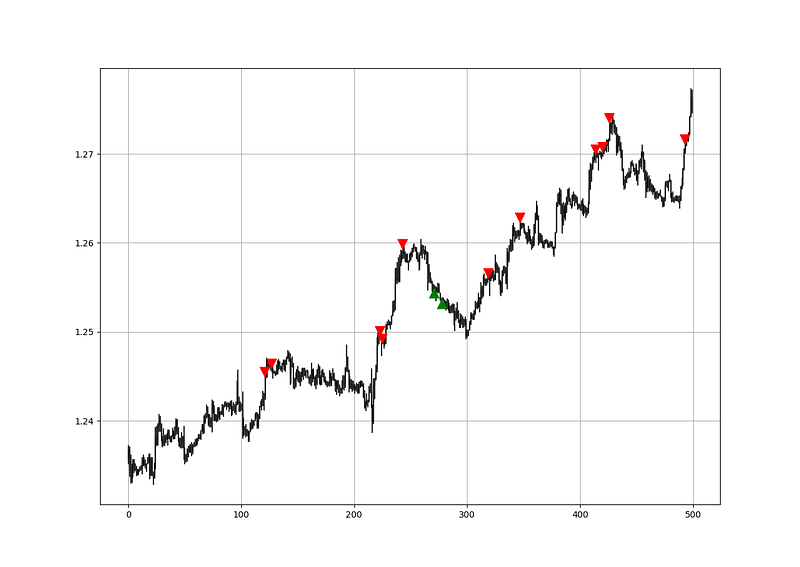
Of course, extensive back-testing must be done to prove that value charts do add ‘value’ to our trading.
If you want to see how to create all sorts of algorithms yourself, feel free to check out Lumiwealth. From algorithmic trading to blockchain and machine learning, they have hands-on detailed courses that I highly recommend.
Summary
To sum up, what I am trying to do is to simply contribute to the world of objective technical analysis which is promoting more transparent techniques and strategies that need to be back-tested before being implemented. This way, technical analysis will get rid of the bad reputation of being subjective and scientifically unfounded.
I recommend you always follow the the below steps whenever you come across a trading technique or strategy:
- Have a critical mindset and get rid of any emotions.
- Back-test it using real life simulation and conditions.
- If you find potential, try optimizing it and running a forward test.
- Always include transaction costs and any slippage simulation in your tests.
- Always include risk management and position sizing in your tests.
Finally, even after making sure of the above, stay careful and monitor the strategy because market dynamics may shift and make the strategy unprofitable.


