Using VisualVM to visualize GC and Memory Utilization of your Java App.
Java VisualVM is a tool that provides a visual interface for viewing detailed information about Java based applications while they are running on a Java Virtual Machine (JVM). Java VisualVM organizes JVM data that is retrieved by the Java Development Kit (JDK) tools and presents information .You can view data on local applications and applications that are running on remote hosts as well.
Visual VM extends its functionality by plug-ins . Using Visual GC plugin and jstatd process on your local or remote , We can visualize memory usages of our application.
Monitoring memory using VisualGC
1) Installing visual GC plugin in VisualVM
2) Running jstatad process
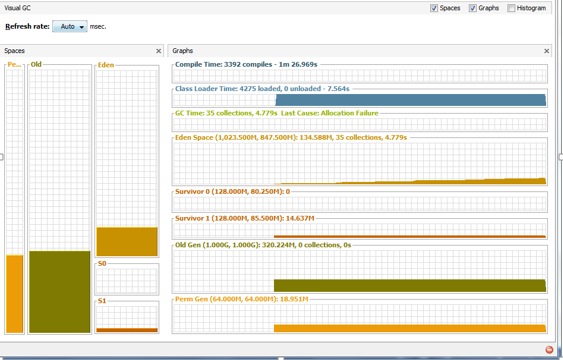
Visual GC tool attaches to an instrumented HotSpot JVM and collects and graphically displays garbage collection, class loader, and HotSpot compiler performance data.
To install VisualGC
1. Run Java VisualVM, and click “Tools > Plugins”.
2. Click the “Available Plugins” tab and check “Visual GC” in the list.
3. Click the “Install” button and follow the installation screen to finish.
4. Click the new “Visual GC” tab, representing the Visual GC plugin.
Running jstatd process on server side.
Jstatd can be found in tools folder of java installation. To run this process we have to provide the permission. So I have written below script, which will enable memory monitoring as well Will run jstadt
#!/bin/sh
policy=${HOME}/.jstatd.all.policy
[ -r ${policy} ] || cat >${policy} <<’POLICY’
grant codebase “file:${java.home}/../lib/tools.jar” {
permission java.security.AllPermission;
};
POLICY
jstatd -J-Djava.security.policy=${policy} &
Once jstatd process run, you can connect to server or process using VisualVM monitoring capability and visualize the GC and memory usages.


