Free AI web copilot to create summaries, insights and extended knowledge, download it at here
3720
Abstract
o.readmedium.com/v2/resize:fit:320/1*GmNm1806e1Gzf-3mgWlfcA.png)"></div>
</div>
</div>
</a>
</div><div id="0ad6" class="link-block">
<a href="https://towardsdatascience.com/generate-hex-maps-from-your-existing-spatial-data-in-less-than-3-steps-a6f39d778d84">
<div>
<div>
<h2>Generate Hex Maps from your existing Spatial Data in less than 3 steps</h2>
<div><h3>Spatial Visualisation — Using the combined power of Turf and Hextile JavaScript libraries to generate hex maps</h3></div>
<div><p>towardsdatascience.com</p></div>
</div>
<div>
<div style="background-image: url(https://miro.readmedium.com/v2/resize:fit:320/1*5E_S69SNwk5sZxrMj6Iiog.png)"></div>
</div>
</div>
</a>
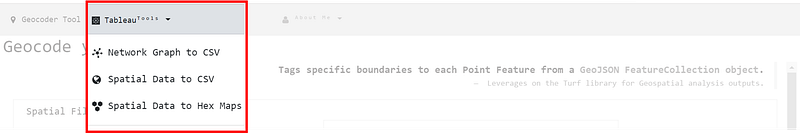
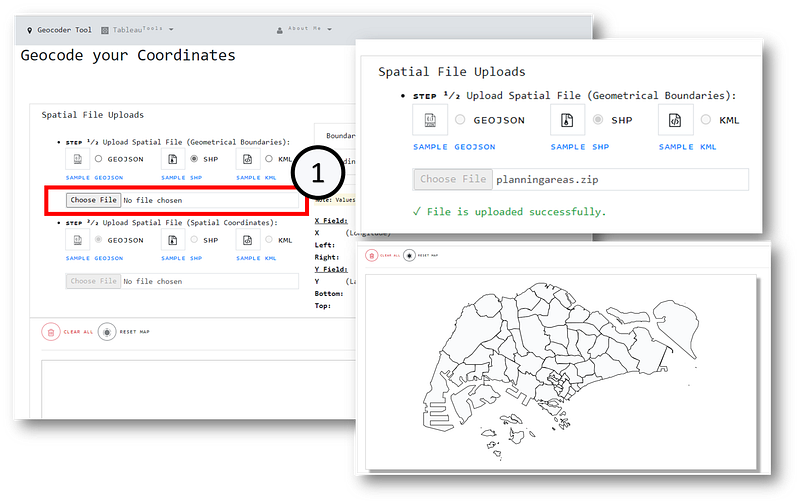
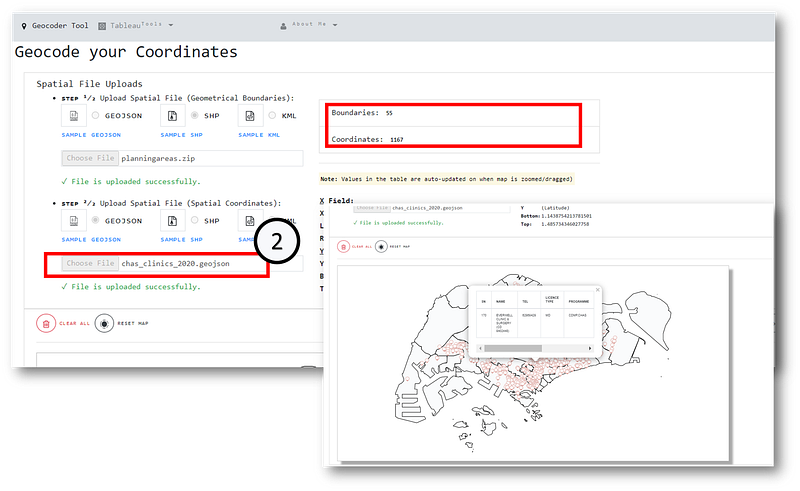
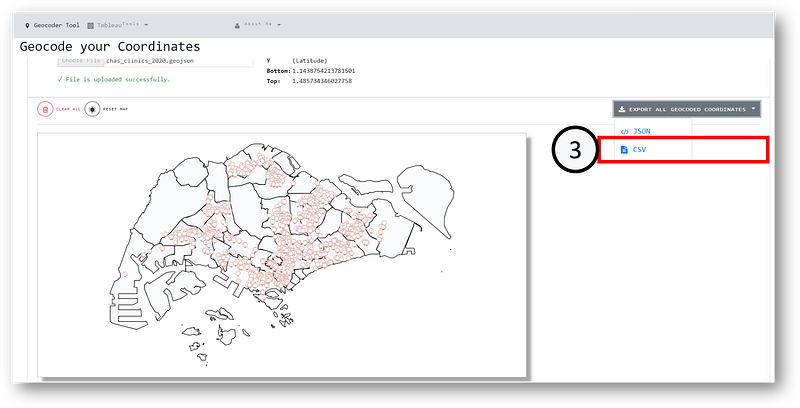
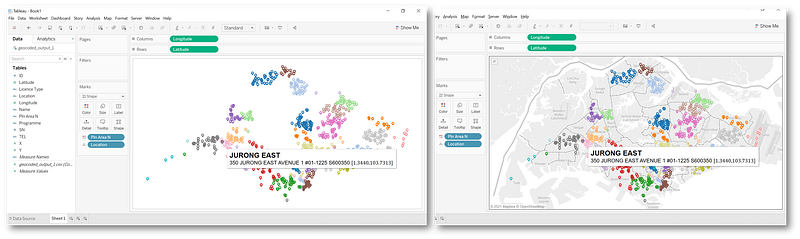
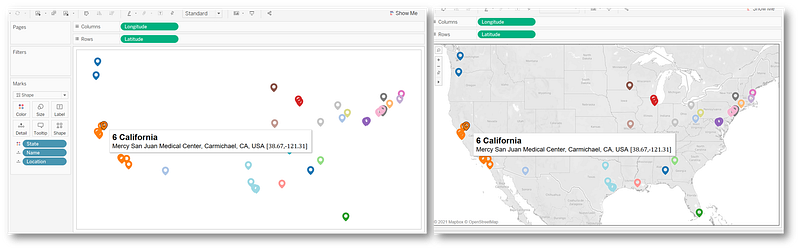
</div><p id="30a8">FYI: The respective utilities from the above articles can be accessed via the very same <a href="https://tableau-data-utility.onrender.com/">Web Application</a>:</p><figure id="d507"><img src="https://cdn-images-1.readmedium.com/v2/resize:fit:800/1*DxxRhFGKMB5xLw80FhM06Q.png"><figcaption>Image by Author | Note that the past 3 Tableau Utility Tools are currently placed in a dropdown list at <a href="https://tableau-data-utility.onrender.com/">Tableau Data Utility</a></figcaption></figure><p id="aa48">For demonstration, I shall be using the 2 input spatial files (Formats GeoJSON, SHP & KML are accepted)—</p><p id="8b85">(1) Spatial Boundaries (<a href="https://github.com/incubated-geek-cc/tableau-data-utility/blob/master/public/data/planningareas.zip">https://github.com/incubated-geek-cc/tableau-data-utility/blob/master/public/data/planningareas.zip</a>)</p><p id="0ba3">(2) Spatial Coordinates (<a href="https://github.com/incubated-geek-cc/tableau-data-utility/blob/master/public/data/chas_clinics_2020.geojson">https://github.com/incubated-geek-cc/tableau-data-utility/blob/master/public/data/chas_clinics_2020.geojson</a>)</p><figure id="b7f1"><img src="https://cdn-images-1.readmedium.com/v2/resize:fit:800/1*UoMUd6eyf6HPRWooULpNpw.png"><figcaption>Image by Author | On the web app <a href="https://tableau-data-utility.onrender.com/">Tableau Data Utility</a>, navigate to “Geocoder Tool”. Step (1) Select the spatial file input (the <a href="https://github.com/incubated-geek-cc/tableau-data-utility/blob/master/public/data/planningareas.zip">spatial boundary file</a> is an archive in SHP format). The boundaries would proceed to render into the map container.</figcaption></figure><figure id="2b9b"><img src="https://cdn-images-1.readmedium.com/v2/resize:fit:800/1*5bHYp6Zh2aF_fezDP_LRmA.png"><figcaption>Image by Author | On the web app <a href="https://tableau-data-utility.onrender.com/">Tableau Data Utility</a>| Step (2) Proceed to select the spatial file input (the <a href="https://github.com/incubated-geek-cc/tableau-data-utility/blob/master/public/data/chas_clinics_2020.geojson">spatial coordinates file</a> is in GeoJSON format). The coordinates would proceed to render into the map container. <b><i>Note: The unique no. of boundaries and coordinates are reflected as shown.</i></b></figcaption></figure><figure id="3a57"><img src="https://cdn-images-1.readmedium.com/v2/resize:fit:800/1*IDXXeOIKh4XISpr6e0vxaw.png"><figcaption>Image by Author | Step (3) Finally, the geocoded output can be exported as either JSON or CSV.</figcaption></figure><p id="4e11">For demonstration, the above has been exported as CSV and rendered in Tableau as shown below:</p><figure id="b975"><img src="https://cdn-images-1.readmedium.com/v2/resize:fit:800/1*AdtpWucMSTDHA5J5RyStKQ.png"><figcaption>
Options
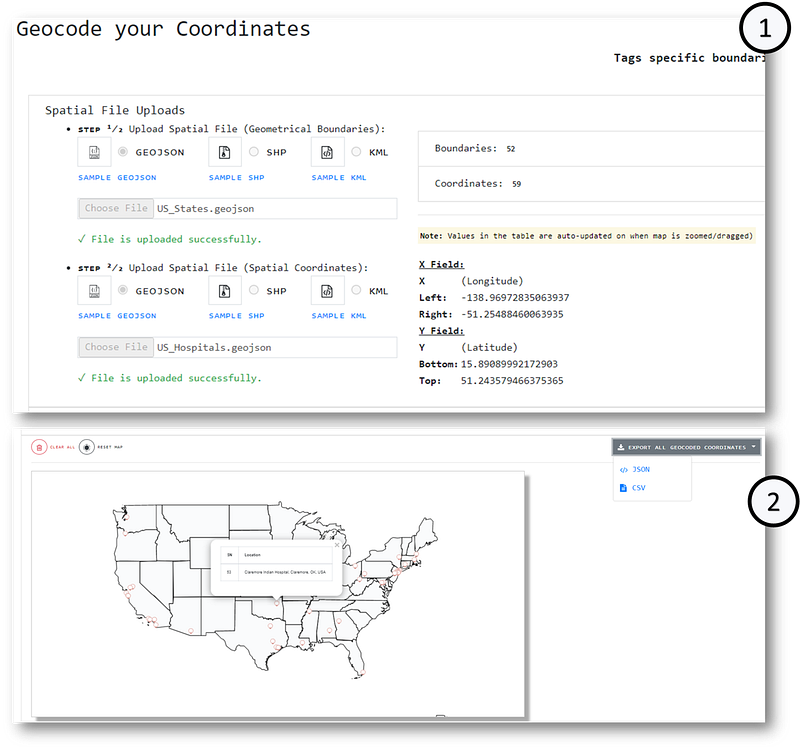
Image by Author | Left image: CSV output is rendered without a basemap and coordinates are colour-coded based on boundary name | Right image: Basemap is rendered to contrast the colour-coded coordinates against the actual boundaries. <b>Note that the coordinates are colour-coded distinctly based on the boundaries of the map, meaning that each location had been geocoded successfully.</b></figcaption></figure><p id="9049">To illustrate another example, the input files (1) <a href="https://github.com/incubated-geek-cc/tableau-data-utility/blob/master/public/data/US_States.geojson">US_States.geojson</a> (spatial boundaries) & (2) <a href="https://github.com/incubated-geek-cc/tableau-data-utility/blob/master/public/data/US_Hospitals.geojson">US_Hospitals.geojson</a> (spatial coordinates) are used in the following demo instead:</p><figure id="7fff"><img src="https://cdn-images-1.readmedium.com/v2/resize:fit:800/1*6nT44oOE0n2M9z-TLUA7pw.png"><figcaption>Image by Author | Step (1) Both spatial files <a href="https://github.com/incubated-geek-cc/tableau-data-utility/blob/master/public/data/US_States.geojson">US_States.geojson</a> & <a href="https://github.com/incubated-geek-cc/tableau-data-utility/blob/master/public/data/US_Hospitals.geojson">US_Hospitals.geojson</a> are uploaded at <a href="https://tableau-data-utility.onrender.com/">Tableau Data Utility</a> | Step (2) Geocoded coordinates are exported as a single CSV file</figcaption></figure><figure id="7948"><img src="https://cdn-images-1.readmedium.com/v2/resize:fit:800/1*saoPz_d6nWvonhVrXWCa5g.png"><figcaption>Image by Author | The CSV output exported from the previous steps is rendered in Tableau. Based on the basemap boundaries, each US Hospital coordinate had been geocoded successfully.</figcaption></figure><p id="54bf">Feel free to access this Geospatial tool at <a href="https://tableau-data-utility.onrender.com/">Tableau Data Utility</a> and try it out by uploading your own spatial files :D</p><p id="76ee"><b>Side note:</b> <a href="https://turfjs.org/">Turf.js library</a> is surprisingly underrated and amazingly versatile. To view how <a href="https://turfjs.org/">Turf.js</a> can be used for other use-cases, feel free to check out:</p><div id="0538" class="link-block">
<a href="https://towardsdatascience.com/generate-hex-maps-from-your-existing-spatial-data-in-less-than-3-steps-a6f39d778d84">
<div>
<div>
<h2>Generate Hex Maps from your existing Spatial Data in less than 3 steps</h2>
<div><h3>Spatial Visualisation — Using the combined power of Turf and Hextile JavaScript libraries to generate hex maps</h3></div>
<div><p>towardsdatascience.com</p></div>
</div>
<div>
<div style="background-image: url(https://miro.readmedium.com/v2/resize:fit:320/1*5E_S69SNwk5sZxrMj6Iiog.png)"></div>
</div>
</div>
</a>
</div><p id="75eb">Thanks for reading and hope you found this useful!</p><div id="c800" class="link-block">
<a href="https://geek-cc.medium.com/membership">
<div>
<div>
<h2>Join Medium with my referral link - Charmaine Chui</h2>
<div><h3>Gain full access to every post by Charmaine Chui and other fellow writers on Medium! 😃 Your membership fee directly…</h3></div>
<div><p>geek-cc.medium.com</p></div>
</div>
<div>
<div style="background-image: url(https://miro.readmedium.com/v2/resize:fit:320/0*XJZWPml6UJlFxzTW)"></div>
</div>
</div>
</a>
</div></article></body>