
Using The Smart Money Index In Stock Trading Strategies

The Smart Money Index (SMI) is a trading strategy that believes in the power of informed investment decisions, particularly those made by institutional investors.
This unique index draws insights from the trading day's crucial opening and closing hours. While the market's opening hour often reflects the general public's sentiment, the SMI focuses on the final hour — a time dominated by the seasoned moves of institutional players.
These players, often called the 'smart money', are believed to have a more strategic approach to investing, making decisions based on comprehensive analysis and long-term perspectives.
This approach makes the SMI a compelling tool for stock market analysts and investors, especially in understanding stocks with significant volatility and investor interest, which we will look at in the post.
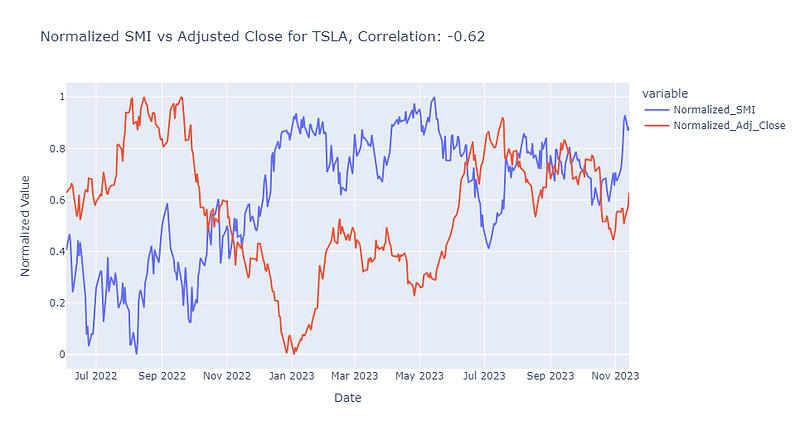
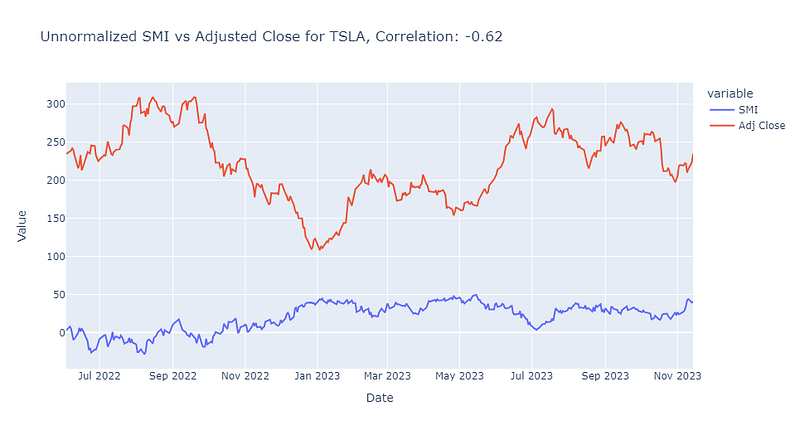
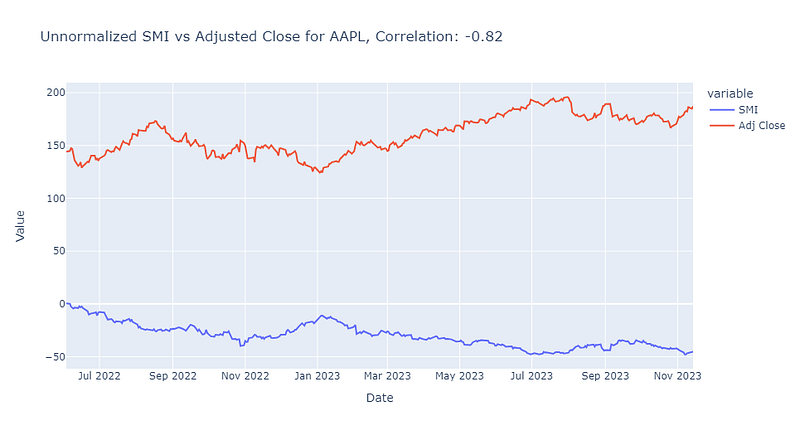
Let's observe the correlation between the SMI Index and the Closing Price of various stocks and observe their relationship. Here, we will create two signals, a normalised and unnormalised SMI Index against the Closing Price.
Why both normalised and unnormalised SMI Indexes, you might be wondering. This is because normalising may obscure the magnitude of the SMI values, which can be informative when developing a trading signal. However, since we are only trading on a single asset, e.g. a single stock, normalisation is acceptable in this instance.
Point to note: Normalisation does not affect the correlation between variables!
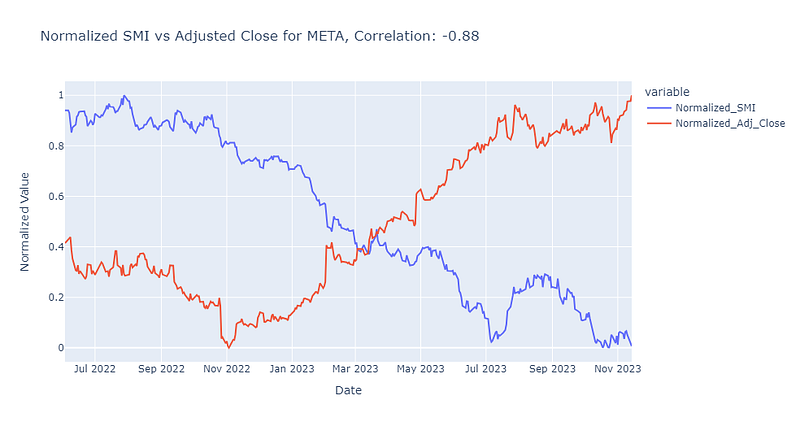
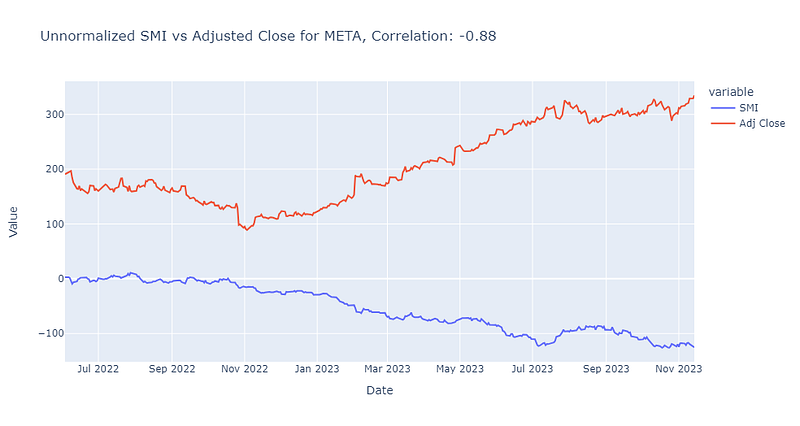
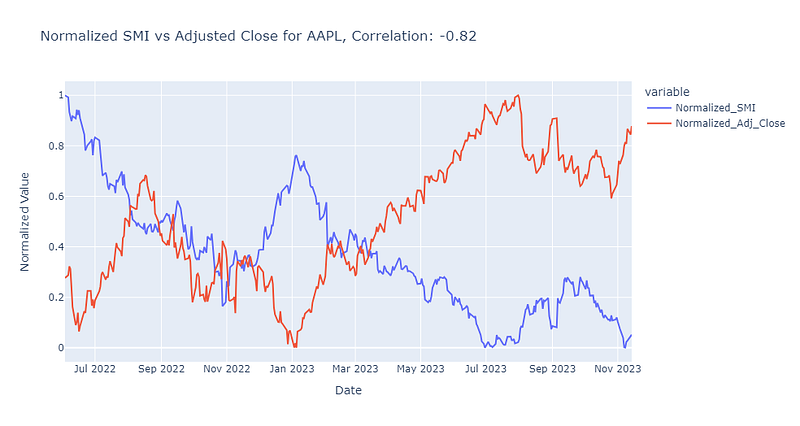
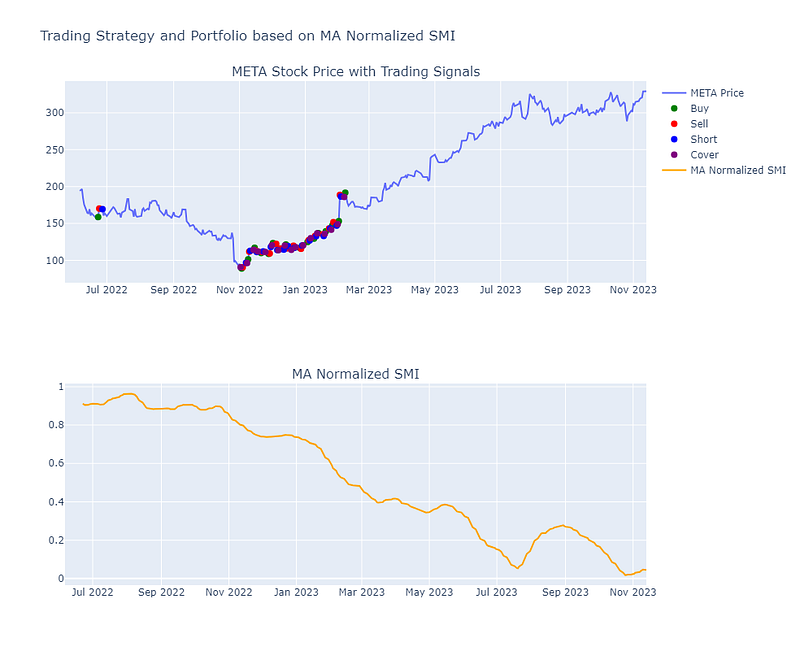
Based on these examples, META has a significant negative correlation with the SMI so we will use it as our example. We will also smooth the signal (Normalised SMI) so that it is less sensitive to short-term market fluctuations and provides a more stable and reliable indicator for our trading strategy. This smoothing process helps to filter out 'noise' in the data, allowing us to focus on more significant trends and patterns.
Take Your Trading to the Next Level — Get the Barebone Jupyter Notebook Script Now!
For those eager to implement and experiment with this trading strategy discussed in this article, a barebone Python Jupyter Notebook trading script can also be found here. This script offers a hands-on opportunity to understand and apply the SMI strategy in real-world trading scenarios.
For this post, we will test the SMI, creating a simple trading strategy and seeing how it performs. Here are the criteria we are using:
- Buy Signal: The strategy generates a buy signal when the moving average of the Normalized SMI falls below a specified threshold. This is interpreted as a potential stock undervaluation, assuming the price may increase soon.
- Sell Signal: A sell signal is generated when the moving average of the Normalized SMI rises above a different threshold, and the strategy currently holds a long position initiated by a buy signal. This indicates a potential overvaluation, suggesting the price might soon decrease.
- Short Signal: The strategy also includes a shorting mechanism, where a short signal is generated if the moving average of the Normalized SMI is above the threshold. This implies that the stock might be overvalued, and its price may decrease.
- Cover Signal: Correspondingly, a cover signal is generated when the moving average of the Normalized SMI falls below the threshold, indicating a potential rise in the stock’s price, suitable for covering the short position.
- Initial Capital and Transaction Costs: The strategy begins with an initial capital of $10,000. Each trade (buy, sell, short, cover) incurs a fixed transaction cost of $2.
- Investment Fraction: The strategy deploys 50% of the available capital for each trade to purchase or short the stock.
- Profit Margin and Trade Execution: The strategy calculates an expected profit, considering a 5% profit margin before executing a buy or short trade. A trade is executed only if the expected profit exceeds the transaction cost.
- Optimization Objective: The objective function for Bayesian optimization aims to maximize a composite score combining total profit, average trade returns per trade, and total number of trades.
- Portfolio Evaluation: The code also compares the trading strategy’s performance against a simple buy-and-hold strategy for SPY (S&P 500 ETF), evaluating the total profit, percentage gain/loss, and the number of trades for each strategy.
To learn more about optimisation techniques:
After applying the trading logic, this is our results:

As such, this article explores the Smart Money Index (SMI), a trading strategy that leverages the investment acumen of institutional investors and how one could utilise it to build an algorithmic strategy.
If you are interested in similar articles, please feel free to check out the following:
Have fun trading!
P.S. Are you looking to organise all your trading charts, strategies and markets in one place?